
Exploring Power Function Graphs
Loading the math board and drawing, please wait…
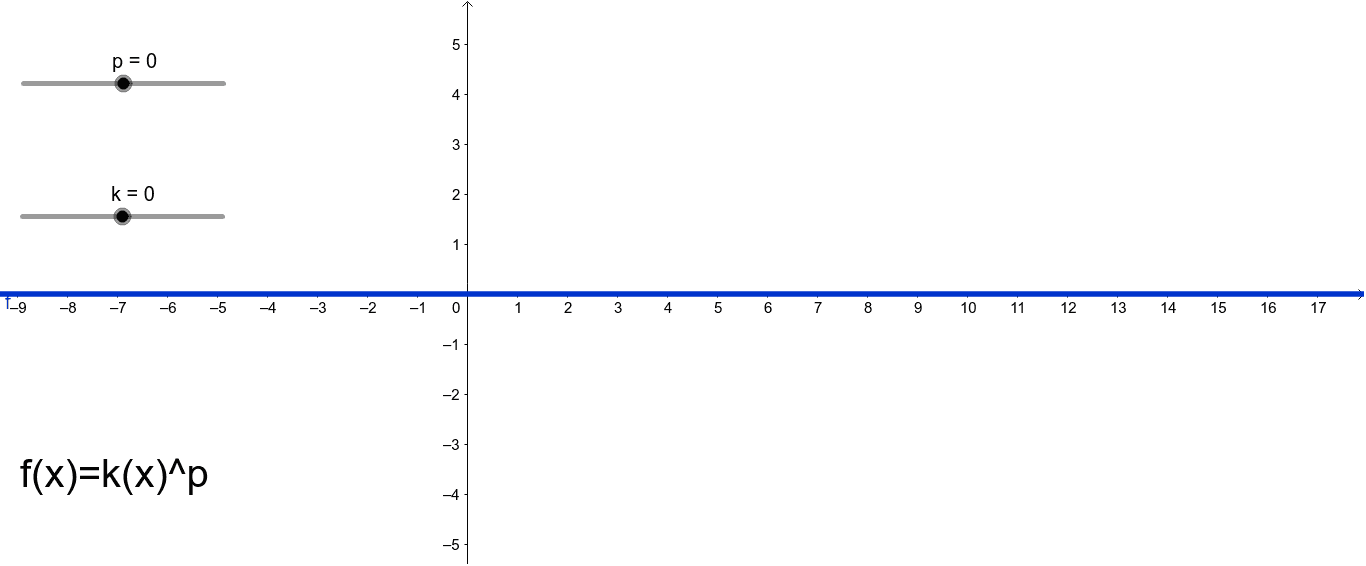
This example demonstrates the behavior of power functions y=kx^p, focusing on how coefficients k and exponents p influence the graph. Key math concepts include power function properties, analytical geometry, and graphing techniques. Constructed using GeoGebra commands like LaTeX for the function f, sliders for k and p, and text objects text1, text2 to display parameters and graph characteristics. Ideal for high school mathematics education to understand power function graphs and their characteristics.
GeoGebra Commands & Parameters
LaTeX(f, true, true) → text1
AI Drawing Prompt Reference
Draw a graph of the power function y = kx^p where k and p are adjustable parameters. Show how the graph changes with different values of k and p, and label key points such as intercepts and vertices. Ensure the graph is clear, including axes and the function curve, to understand the properties of power functions.
The prompt above was compiled from the original drawing commands and is for reference only.