
Exploring Long‑Term Behavior of Polynomial Functions
Loading the math board and drawing, please wait…
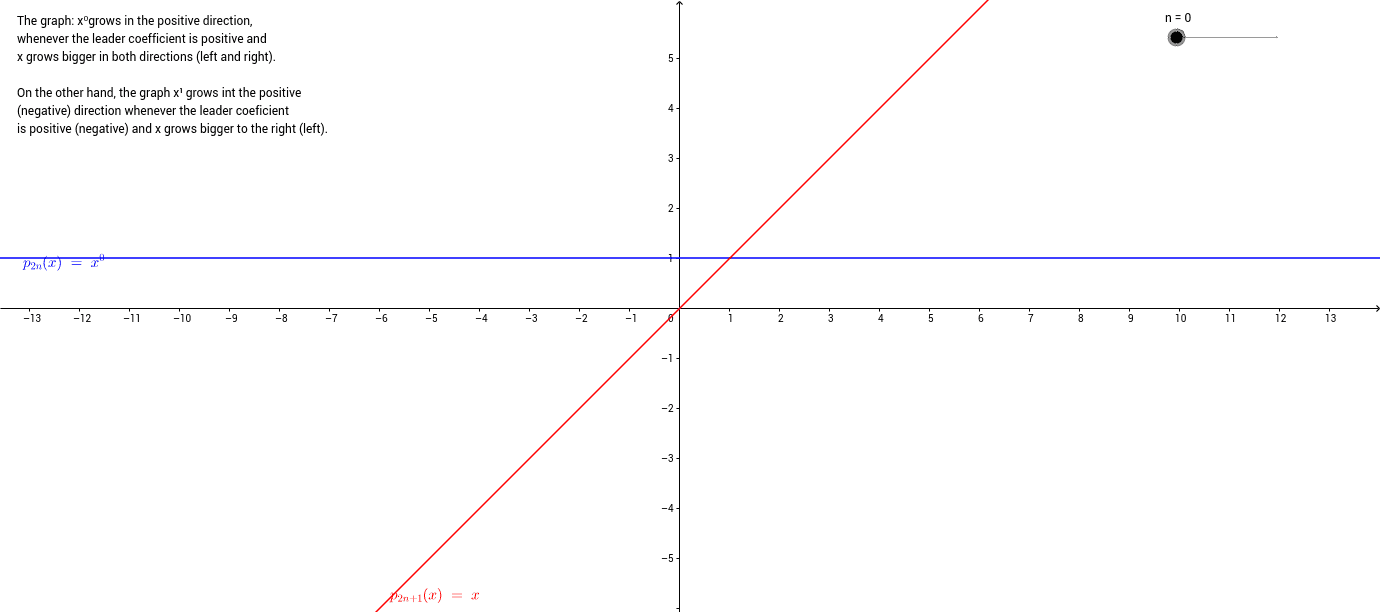
① This example illustrates the long‑term behavior of polynomial functions as x approaches positive or negative infinity, showing how the leading term dominates the graph's shape. ② The core mathematics includes polynomial degree, leading coefficient, end behavior, and limits at infinity. ③ The construction uses a slider n and constant e to generate points p_{2n} and p_{2n+1}, and a text object texto1 to display the asymptotic trend dynamically. ④ It is intended for high‑school algebra and introductory calculus courses.
GeoGebra Commands & Parameters
Numeric n(0.0)2 * np_{2n}(x) = x^(e)2 * n + 1p_{2n+1 }(x) = x^(o)
AI Drawing Prompt Reference
Create a graph that shows a family of polynomial functions controlled by a slider for the degree n and a fixed constant e as the leading coefficient, plotting both the even‑degree curve x^e and the odd‑degree curve x^e, and include a dynamic text label that updates to describe the end behavior of the functions as x approaches positive and negative infinity.
The prompt above was compiled from the original drawing commands and is for reference only.