
Exploring Linear Functions: From Graph to Properties
Loading the math board and drawing, please wait…
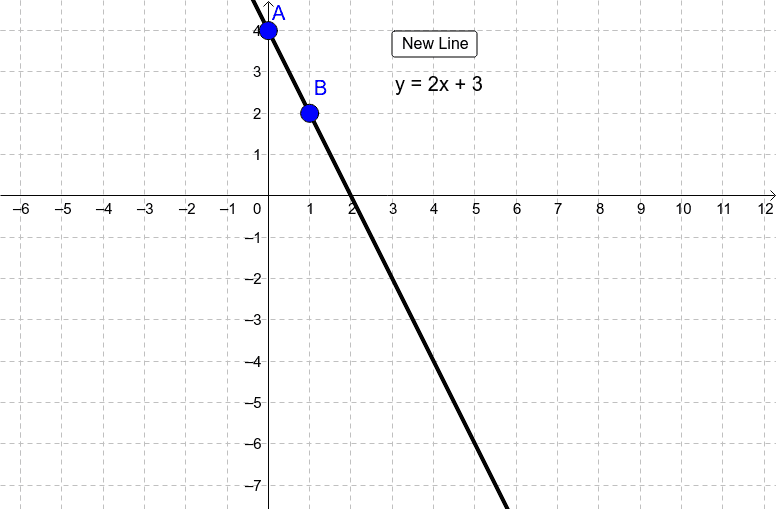
This GeoGebra example dynamically demonstrates the graph and properties of linear functions y = ax + b, visually showing how the slope a and intercept b affect the line's position and steepness. Core mathematical concepts include linear functions, slope, intercept, function graphing, and coordinate geometry. Construction highlights: uses the Line command to create the line, with button1 and text1/text2 for interactive control and dynamic display, while points A and B define key positions on the line. Suitable for middle school to high school students learning function basics, graph transformations, and introductory analytic geometry, as well as for teacher demonstrations or student self-exploration to understand the correspondence between algebraic expressions and geometric graphs.
GeoGebra Commands & Parameters
Line(A, B) → b