
Exploring Linear Functions by Alvaro Serra
Loading the math board and drawing, please wait…
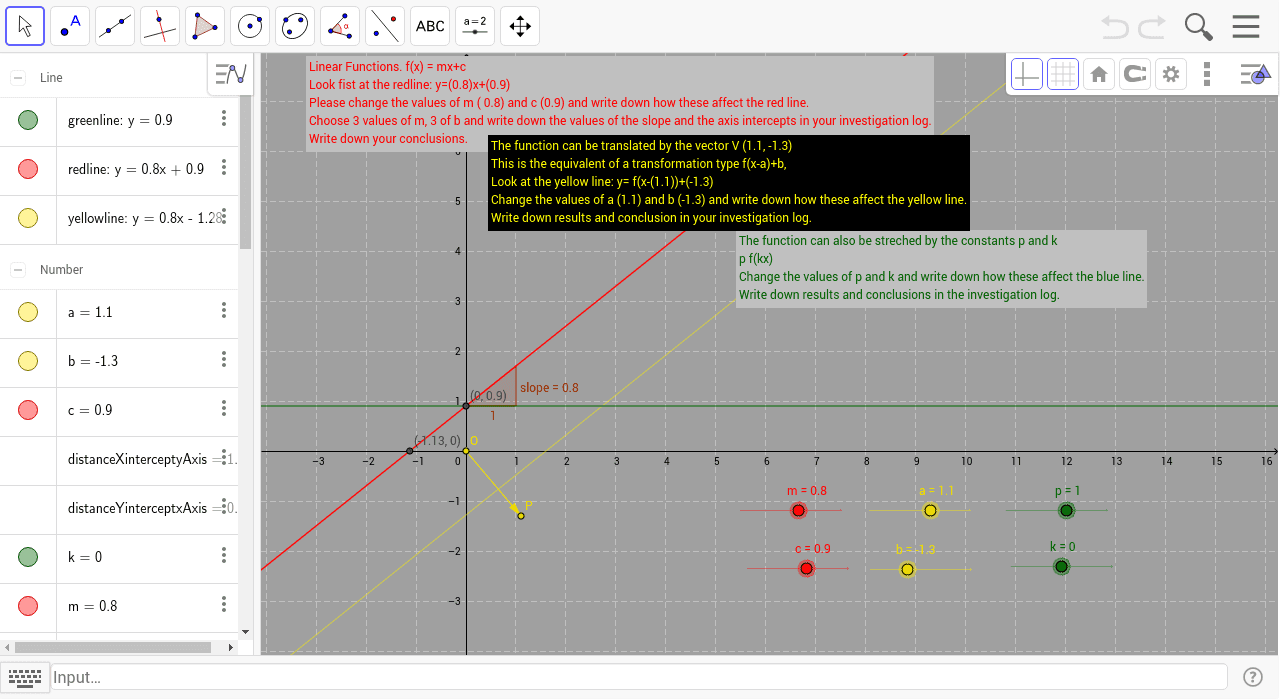
This example uses a GeoGebra dynamic worksheet to demonstrate the graph and properties of linear functions. Key math concepts include slope, intercepts, vectors, and transformations. It leverages GeoGebra commands like Slope, Intersect, Distance, Midpoint, Vector, Translate and objects such as m, c, redline, slope, Yintercept, etc. Ideal for high school mathematics education or self-study to understand the geometric significance and parameter effects on linear functions.
GeoGebra Commands & Parameters
Slope(redline) → slopeIntersect(redline, yAxis) → YinterceptDistance(Yintercept, xAxis) → distanceYinterceptxAxisMidpoint(Yintercept, ClosestPoint[xAxis, Yintercept]) →Intersect(redline, xAxis) → XinterceptDistance(Xintercept, yAxis) → distanceXinterceptyAxisMidpoint(Xintercept, ClosestPoint[yAxis, Xintercept]) →Intersect(xAxis, yAxis) → OVector(O, P) → uTranslate(redline, u) → yellowline
AI Drawing Prompt Reference
Draw a straight line, mark its intersections with the x-axis and y-axis, and calculate the distance from the origin to these points. Create a vector from the origin to the x-axis intersection point and use it to translate the line along its direction to get a parallel line. Show all intersection points, the vector, and the translated line, labeling the slope and intercepts.
The prompt above was compiled from the original drawing commands and is for reference only.