
Sine Function Investigation
Loading the math board and drawing, please wait…
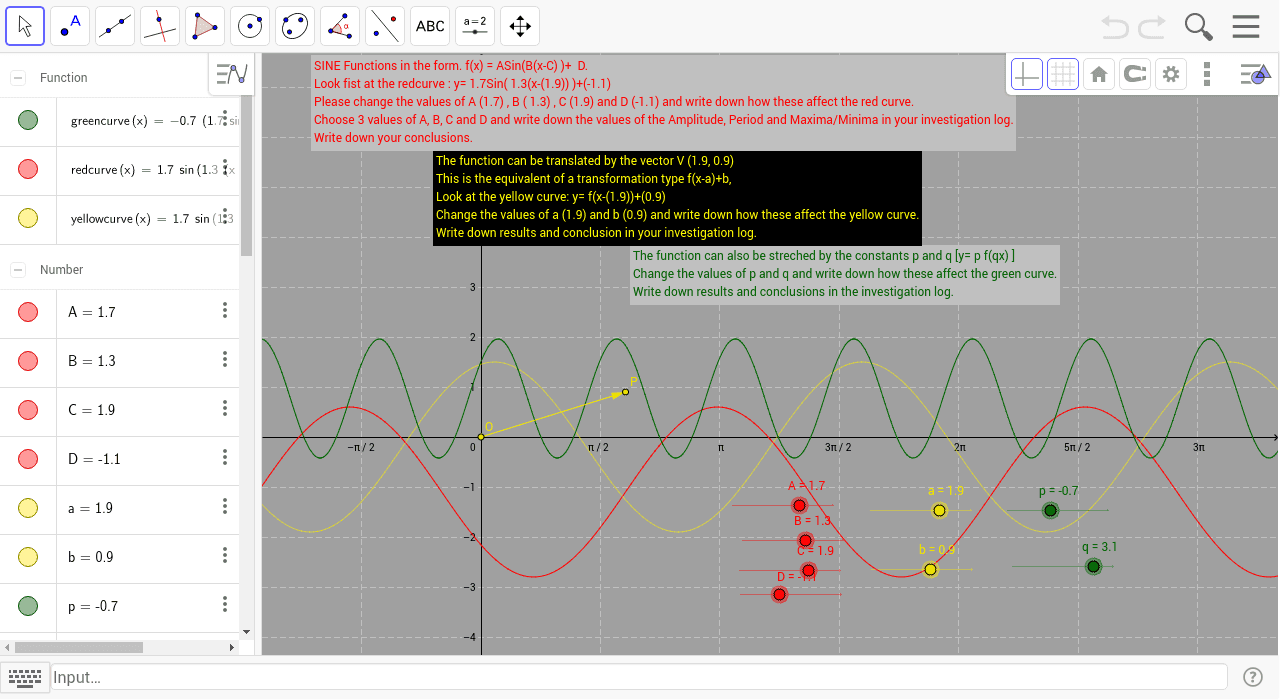
This example uses a GeoGebra dynamic worksheet to demonstrate the graph and properties of the Sine function. ① It illustrates the formation of the sine wave and its relationship with the unit circle; ② Key math concepts include trigonometric functions, function graphs, unit circle, vectors, etc.; ③ Construction highlights involve GeoGebra commands like Intersect, Vector, Translate, and objects such as D, A, C, B, a, b, P, O, u, text3, p, q, redcurve, yellowcurve, text2, greencurve, text1; ④ Suitable for high school students to understand the drawing and property analysis of trigonometric function graphs.
GeoGebra Commands & Parameters
Intersect(xAxis, yAxis) → OVector(O, P) → uTranslate(redcurve, u) → yellowcurve
AI Drawing Prompt Reference
Draw a sine function graph to illustrate its relationship with the unit circle, including a dynamic demonstration of the sine wave formation. The diagram should feature a coordinate axis intersection point, a vector from the origin to a point, and the sine curve translated along this vector, helping to understand the geometric properties of the sine function.
The prompt above was compiled from the original drawing commands and is for reference only.