
Exploring Linear Equation Parameters
Loading the math board and drawing, please wait…
In collections
Learn GeoGebra Classic
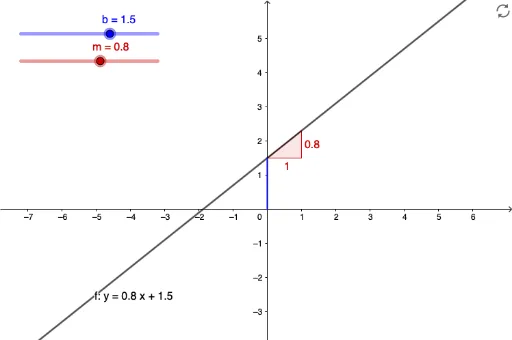
This example demonstrates how to dynamically adjust the slope (m) and y-intercept (b) in the linear equation y=mx+b using sliders, observing the changes in the line's graph. Key math concepts include linear functions, slope, y-intercept, and parameterization. GeoGebra commands used are Intersect, Segment, and Slope, with objects like m, b, f, A, B, g, m_1. Suitable for high school students to understand the impact of parameters on linear graphs and for analytical geometry instruction.
GeoGebra Commands & Parameters
Intersect(f, yAxis) → AIntersect(xAxis, yAxis) → BSegment(B, A) → gSlope(f) → m_1
AI Drawing Prompt Reference
Draw a line controlled by two sliders for slope and y-intercept to explore the linear equation y=mx+b. Start by plotting the coordinate axes, then draw the line based on the slider values for slope and y-intercept. Mark the intersection point of the line with the y-axis, and connect this point to the origin to visually demonstrate the effect of the y-intercept.
The prompt above was compiled from the original drawing commands and is for reference only.