
Exploring Inverse Trigonometric Functions
Loading the math board and drawing, please wait…
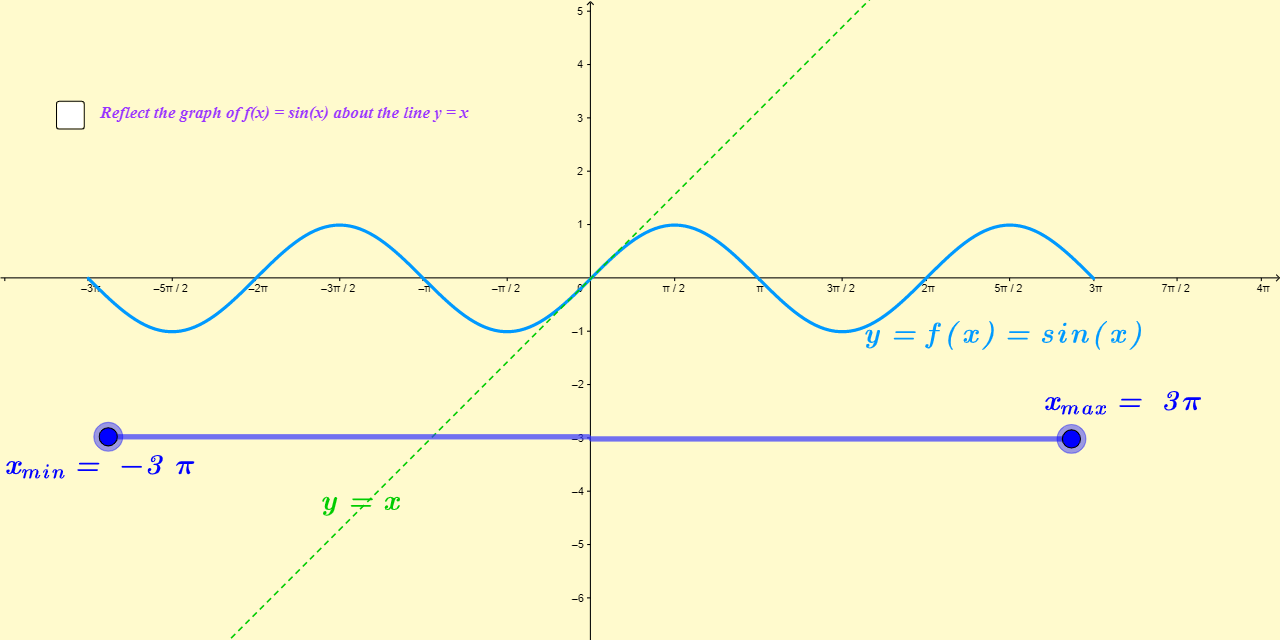
This example demonstrates the graphs and properties of inverse trigonometric functions. Using geometric construction, it shows the graphs of inverse sine, inverse cosine, and inverse tangent functions. It utilizes commands like Mirror and FractionText, suitable for high school math education and learning.
GeoGebra Commands & Parameters
Mirror(f, a) → f_1FractionText(h) → text1FractionText(i) → text3
AI Drawing Prompt Reference
Draw the graphs of the inverse functions of sine, cosine, and tangent. First, plot the graph of the sine function, then use mirroring to obtain the graph of the inverse sine function and add a label to show its value. Repeat this process for the inverse cosine and inverse tangent functions, adding labels as needed.
The prompt above was compiled from the original drawing commands and is for reference only.