
Exploring Function End Behavior
Loading the math board and drawing, please wait…
In collections
Rational Functions
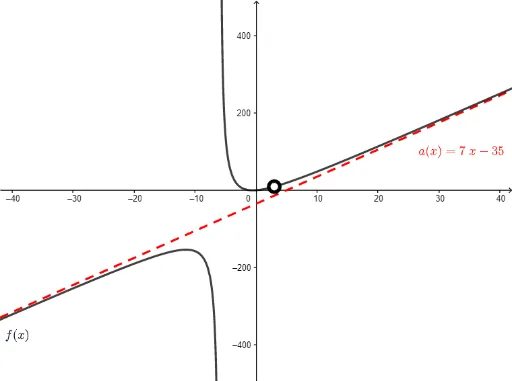
This example demonstrates the behavior of functions at infinity, focusing on asymptotic behavior. Key math concepts include limits of functions, asymptotes, discontinuities, and critical points. Construction highlights involve using GeoGebra commands like Division, Textfield, Length, Sequence, Union, and Intersection to analyze and plot function graphs. Suitable for high school and above, helping learners understand the global properties of functions and techniques for complex graphing.
GeoGebra Commands & Parameters
Division(n, d) → QuotientRemainderTextfield(n) → InputBox1Textfield(d) → InputBox2Length(list) → DiscCountSequence(x(list(i)), i, 1, DiscCount) → DiscontinuitiesUnion(Close, Discontinuities) → ImportantXsIntersection(rootsd, rootsn) → commonrootsLength(commonroots) → numberofholesSequence(x(Element[commonroots, i]), i, 1, numberofholes, 1) → xvalsSequence(Limit[f, Element[xvals, i]], i, 1, numberofholes, 1) → yvalsSequence((Element[xvals, i], Element[yvals, i]), i, 1, numberofholes, 1) → holes
AI Drawing Prompt Reference
Plot a function to illustrate its behavior at infinity, highlighting asymptotes, limits, discontinuities, and critical points. Use distinct colors for different asymptotes and label the limit values at infinity.
The prompt above was compiled from the original drawing commands and is for reference only.