
Exploring Correlation Coefficient Scatter Plots
Loading the math board and drawing, please wait…
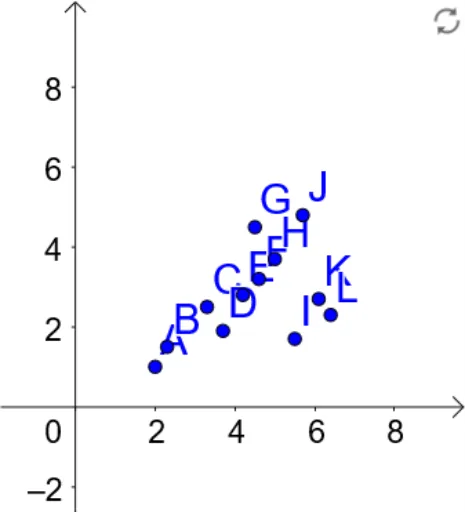
This example explores correlation coefficients through scatter plots, demonstrating how to observe linear relationships by adjusting point positions. Key mathematical concepts include correlation coefficients and scatter plots. The GeoGebra command PMCC is used to calculate the correlation coefficient. Suitable for high school mathematics education and learning.
GeoGebra Commands & Parameters
PMCC({A, B, C, D, E, F, G, H, I, J, K, L}) → a
AI Drawing Prompt Reference
Create scatter plots with points that can be adjusted to demonstrate linear relationships, and calculate the correlation coefficient among them to explore the concept of correlation coefficients.
The prompt above was compiled from the original drawing commands and is for reference only.