
Exploring Averages and Outliers
Loading the math board and drawing, please wait…
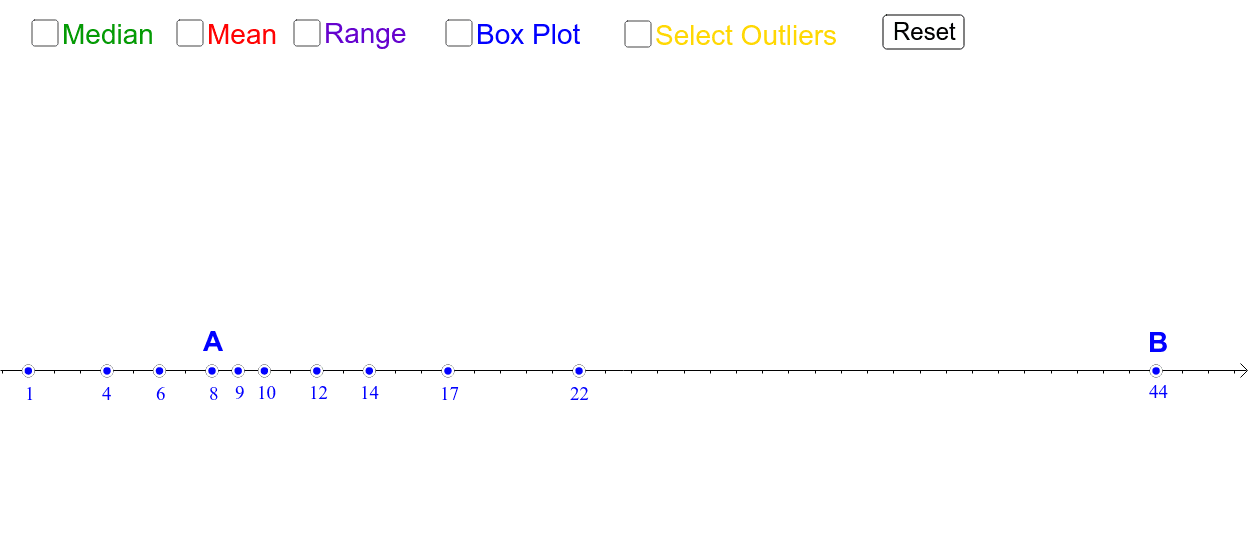
This example demonstrates the impact on measures of averages when moving data points and selecting outliers. It involves core math concepts like Arithmetic Mean, Mode, and Statistical Characteristics. Constructed using commands such as Point, Sequence, RemoveUndefined, Segment, BoxPlot, LineBisector, Intersect, OrthogonalLine and objects like matrix1, list1, etc. Ideal for high school students learning Probability & Statistics to understand data variations effects on statistical measures.
GeoGebra Commands & Parameters
Point(xAxis) → KPoint(xAxis) → JPoint(xAxis) → IPoint(xAxis) → HPoint(xAxis) → BPoint(xAxis) → CPoint(xAxis) → DPoint(xAxis) → EPoint(xAxis) → FPoint(xAxis) → GPoint(xAxis) → ASequence((If[Element[matrix1, 2, i] ≟ 0, Element[matrix1, 1, i]], 0), i, 1, 11) → list1Sequence((If[Element[matrix1, 2, i] ≟ 1, Element[matrix1, 1, i]], 0), i, 1, 11) → list2RemoveUndefined(list1) → list3RemoveUndefined(list2) → list4Segment((Min[x(list3)], 3), (Max[x(list3)], 3)) → mBoxPlot(3, 0.25, x(list3)) → rSequence((Element[list5, i], 3), i, 1, Length[list4]) → list6LineBisector(m) → iIntersect(i, m) → LOrthogonalLine(Median, xAxis) → pOrthogonalLine(Mean, xAxis) → qIntersect(q, xAxis) → MIntersect(p, xAxis) → NSegment(Median, N) → sSegment(Mean, M) → t