
Explore the Sine Curve Transformation
Loading the math board and drawing, please wait…
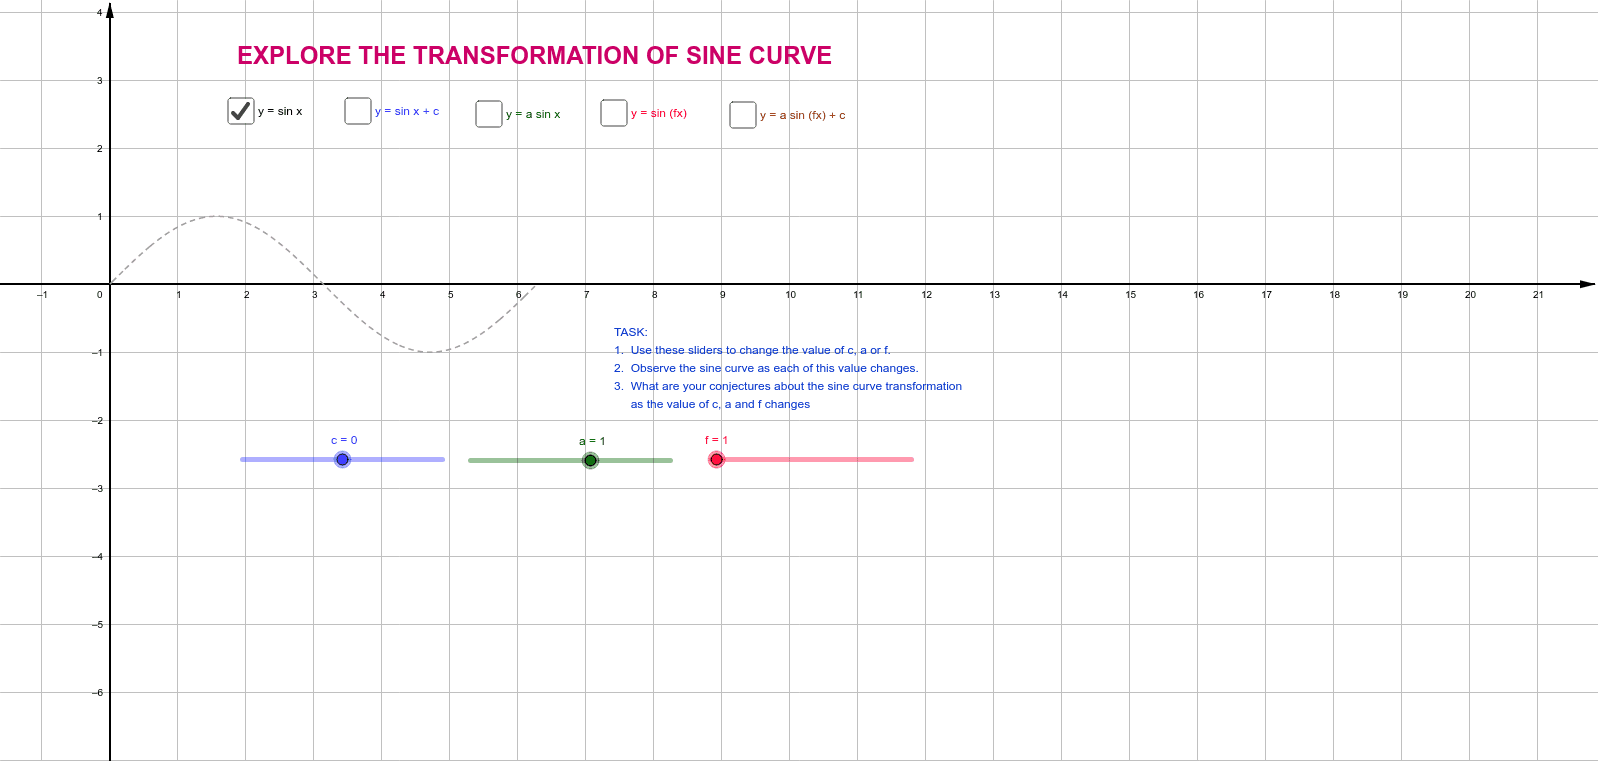
This example demonstrates the transformation of sine curves and the process of sketching their graphs. Key math concepts include trigonometric functions, function graph transformations, and coordinate systems. Construction highlights involve GeoGebra commands/objects like sliders a, c, f to adjust parameters, objects g, h, p, q, b, d, e, i, r, j for drawing curves and auxiliary elements, and text1, text2 for annotations. Suitable for high school mathematics teaching to understand function transformations and graphing techniques.
GeoGebra Commands & Parameters
Numeric a(1.0)Numeric c(0.0)Numeric f(1.0)g(x) = If[0 ≤ x ≤ 6.284, sin(x)]h(x) = If[0 ≤ x ≤ 6.284, sin(x) + c]p(x) = If[0 ≤ x ≤ 6.284, (a * sin(x))]q(x) = If[0 ≤ x ≤ 6.284, sin((f * x))]Boolean b(true)Boolean d(false)Boolean e(false)Boolean i(false)r(x) = If[0 ≤ x ≤ 6.284, (a * sin((f * x))) + c]Boolean j(false)
AI Drawing Prompt Reference
Draw a graph of a sine curve transformation. Include a basic sine curve, a translated sine curve, a scaled sine curve, and a combined curve. The construction order is to draw the basic sine curve first, then translate, then scale, and finally combine. The graph is used to demonstrate sine function transformations and graphing techniques.
The prompt above was compiled from the original drawing commands and is for reference only.