
Explore the base of an exponential parent graph by Robyn Wolfe
Loading the math board and drawing, please wait…
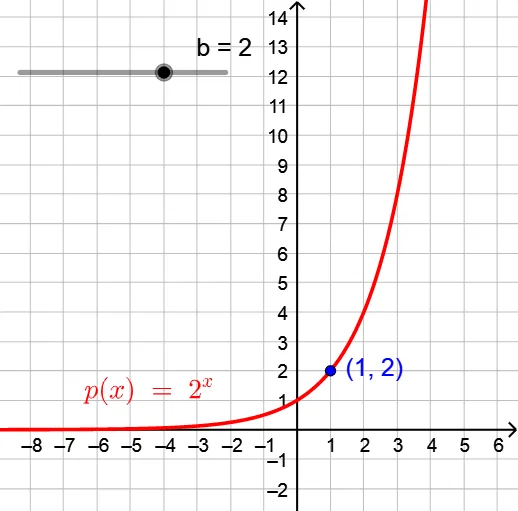
This example demonstrates how the graph of an exponential function changes as the base varies. Key math concepts include exponential function properties and the impact of the base on the graph. GeoGebra commands used: b (base), p (exponent), D (domain). Suitable for high school mathematics teaching to understand the transformation characteristics of exponential function graphs.
GeoGebra Commands & Parameters
Numeric b(2)p(x) = b^(x)(1, p(1))
AI Drawing Prompt Reference
Draw a graph of an exponential function where the base is a variable parameter, initially set to 2. The curve should rise rapidly from left to right, approaching the x-axis on the left and increasing steeply on the right. Mark a specific point on the curve at x=1, with its y-coordinate equal to the base raised to the power 1, so for base 2, the point is at (1,2). The graph should clearly illustrate how changing the base affects the steepness and shape of the exponential curve, suitable for demonstrating basic properties of exponential functions.
The prompt above was compiled from the original drawing commands and is for reference only.