
Explore Riemann Sums
Loading the math board and drawing, please wait…
In collections
BC Calculus
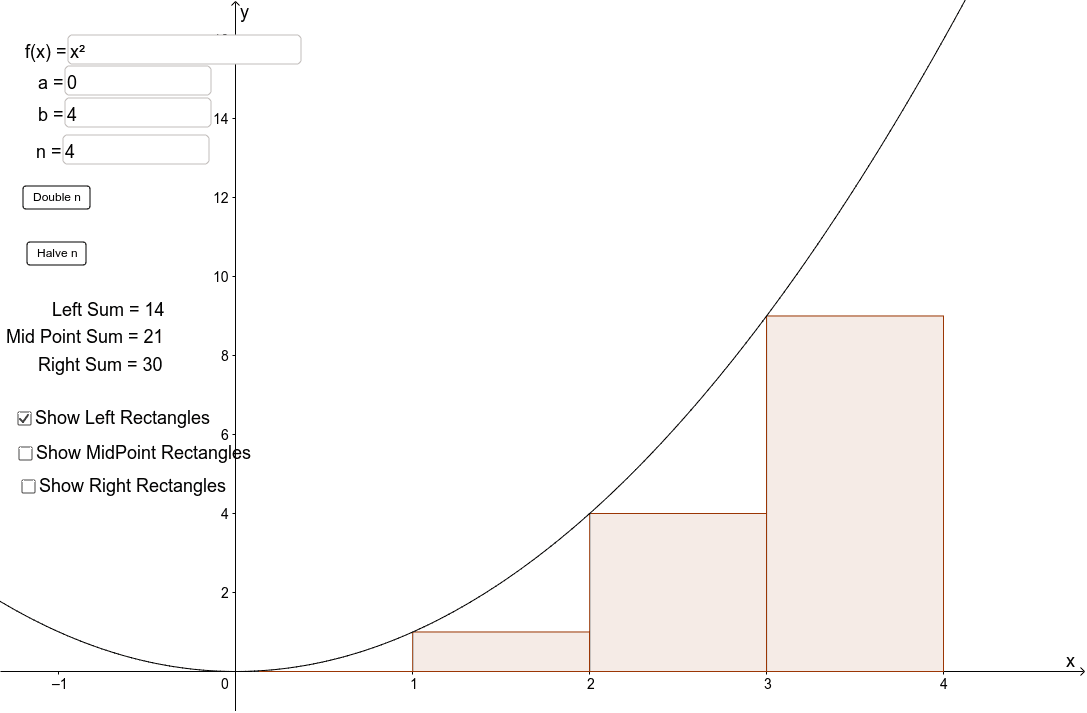
This example demonstrates how to explore Riemann sums for a function over a closed interval by drawing rectangles. Core math concepts include function, integral, and limit. Construction highlights the use of GeoGebra commands and objects like Textfield, LeftSum, RectangleSum, Extremum, Max, Min, etc., with slider animations to adjust the number of subintervals, showing the approximation of left, right, and midpoint Riemann sums. Suitable for high school and early university students learning about integral concepts in calculus.
GeoGebra Commands & Parameters
Textfield(a) → inputBox1Textfield(n) → inputBox3Textfield(f) → inputBox4LeftSum(f, a, b, n) → LeftSumRectangleSum(f, a, b, n, 0.5) → MidPointSumRectangleSum(f, a, b, n, 1) → RightSumTextfield(b) → inputBox2Extremum(f, a, b) → B, DMax(f, a, b) → AMax(f, a, b) → CMax({f(a), f(b), y(A)}) → cMin(f, a, b) → EMin({f(a), f(b), y(E)}) → d
AI Drawing Prompt Reference
Draw a function graph and represent left, middle, and right Riemann sums with rectangles below it, adjustable by a slider for the number of subintervals, while labeling the maxima and minima within the interval and the endpoint values to illustrate the geometric meaning of the integral and the limit process.
The prompt above was compiled from the original drawing commands and is for reference only.