
Explore Linear Graphs (y=mx+c)
Loading the math board and drawing, please wait…
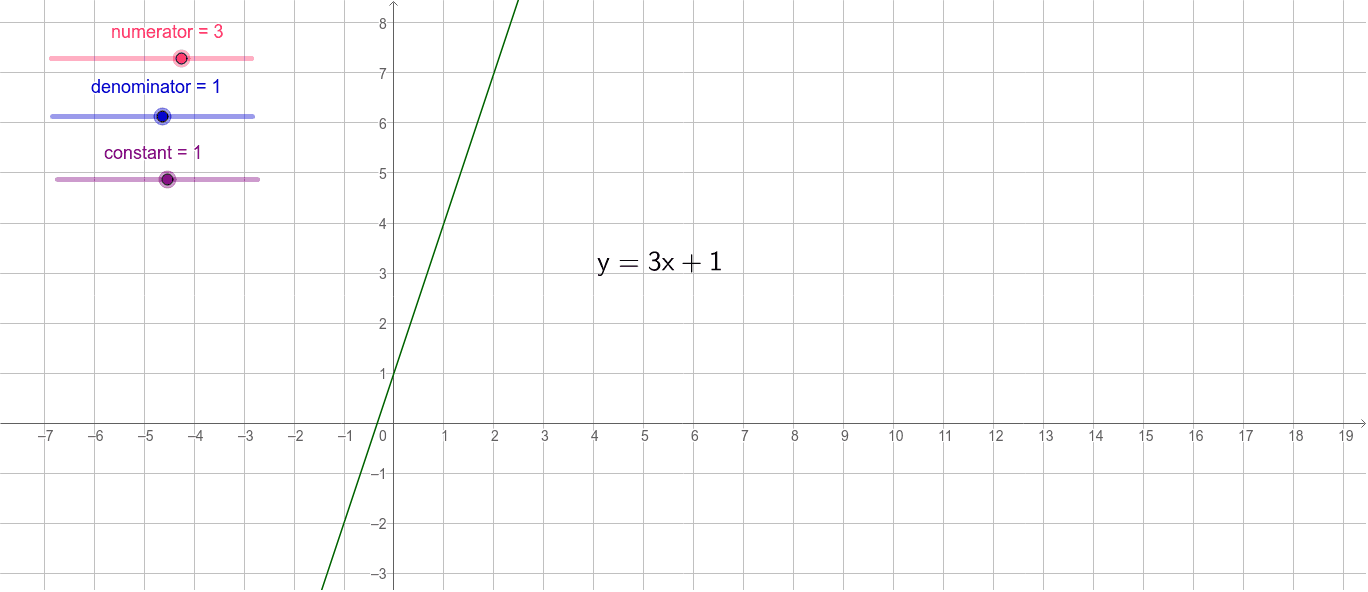
This interactive example demonstrates the linear graph of y=mx+c. Users can explore how the slope m and y-intercept c affect the position of the line. The FractionText command is used to display key parameters such as the numerator, denominator, constant, and gradient. Suitable for students in middle school and above to learn coordinate geometry and linear functions.
GeoGebra Commands & Parameters
FractionText(Slope[a]) → gradient