
Explore Critical Points/Numbers: Interactive Derivative-Based Visualization
Loading the math board and drawing, please wait…
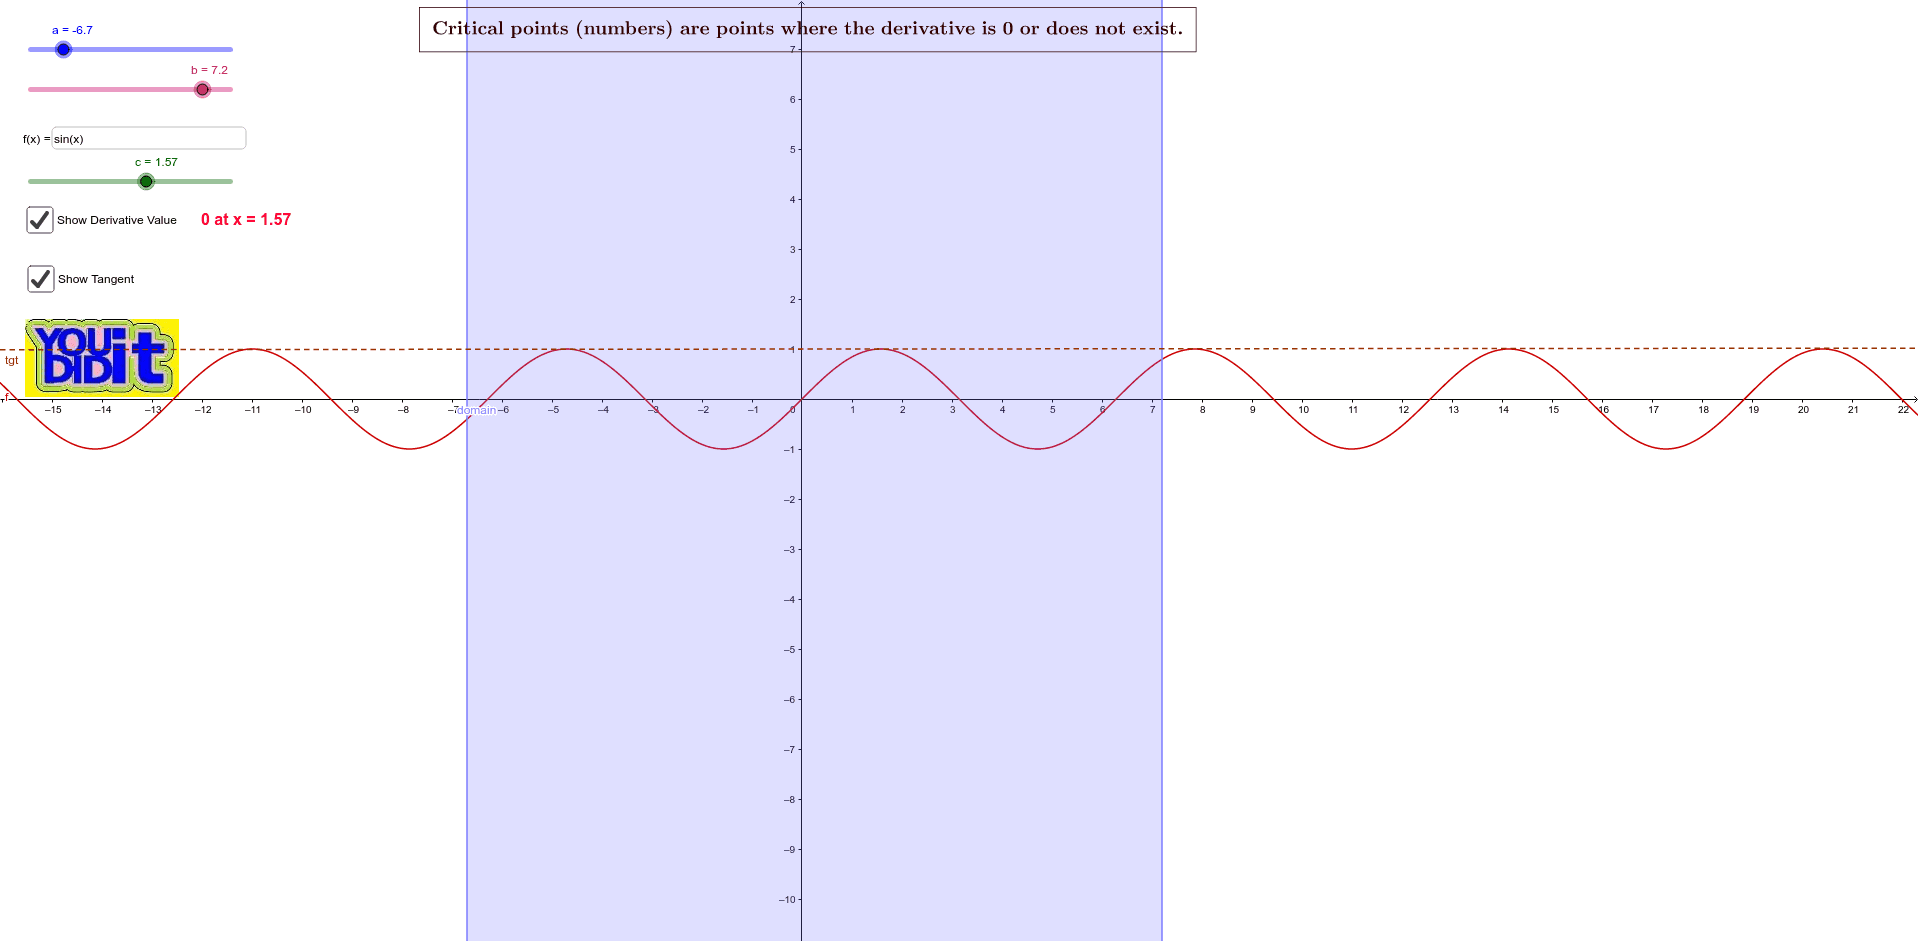
① This GeoGebra applet demonstrates how to identify critical points of a function based on the formal definition: points where the derivative is zero or does not exist, with dynamic visual feedback on the graph. ② Core mathematical concepts include the definition of critical numbers, the geometric meaning of the derivative (tangent slope), and the relationship between derivative sign changes and potential local extrema. ③ Construction highlights: the Derivative command generates f', Textfield and InputBox1 allow users to input the function and candidate x-values, the Defined command checks whether the derivative exists at a point, and objects such as text1, text2, text3, a, b, c, d, e, g, A, B, and pic1 are used to display explanatory text, mark points, draw tangent lines, define the domain, and set the background image. ④ Suitable for high school or introductory college calculus students, this applet serves as an interactive tool for classroom demonstration or self-study, deepening understanding of critical points, derivative existence, and the first-derivative test.
GeoGebra Commands & Parameters
Derivative(f, x) → f'Textfield(f) → InputBox1Defined(der) → d
AI Drawing Prompt Reference
Create a graph showing a function and its derivative to illustrate critical points. Include an input box for the user to enter the function and candidate x-values. Mark points on the curve where the derivative is zero or undefined, and draw tangent lines at those points. Add text annotations explaining the definition of critical numbers, the geometric meaning of the derivative, and how sign changes relate to local extrema. Place a background image for context, keeping the layout clear for classroom use.
The prompt above was compiled from the original drawing commands and is for reference only.