
Explore Best Fit Line
Loading the math board and drawing, please wait…
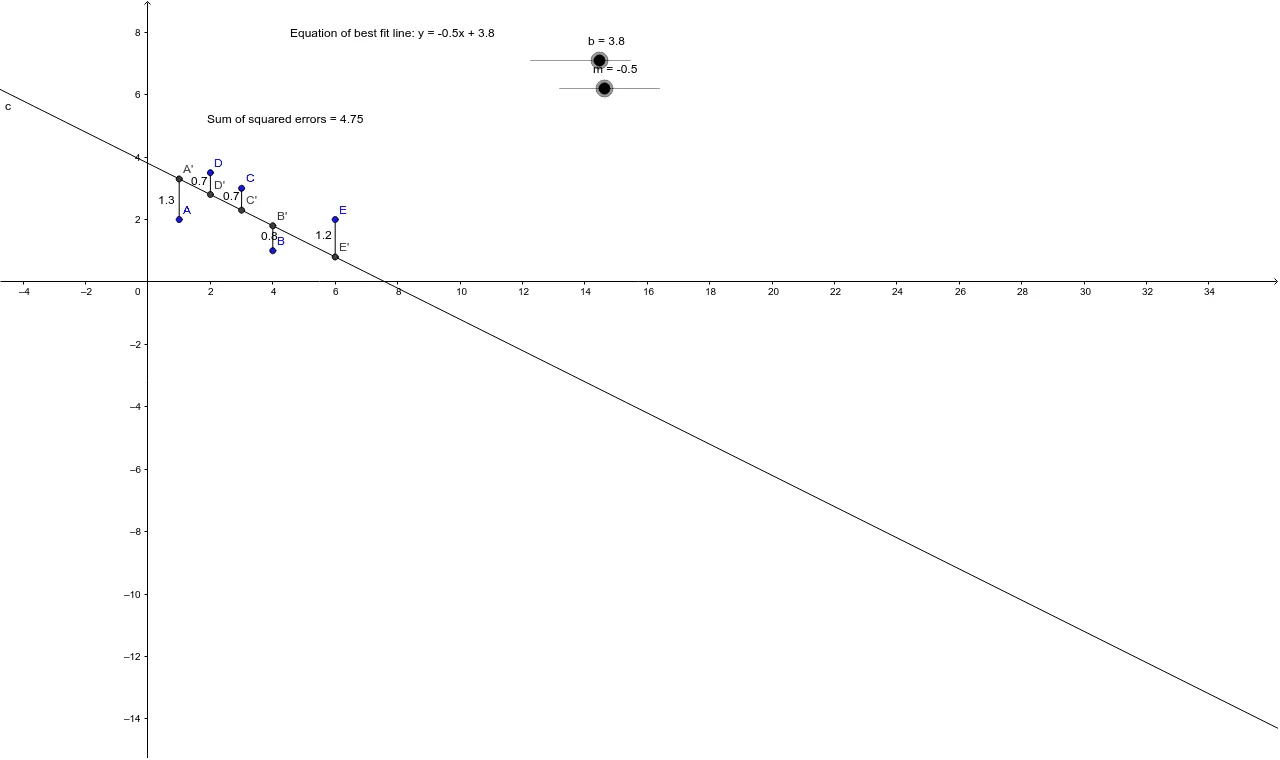
This GeoGebra applet explores the effect of changing a straight line on the sum of squared errors for a set of data points. Key concepts include linear regression and hypothesis testing. Adjust the line to observe error changes. Commands used include OrthogonalLine, Intersect, Segment, etc. Suitable for high school math education and learning.
GeoGebra Commands & Parameters
OrthogonalLine(A, xAxis) → dOrthogonalLine(D, xAxis) → eOrthogonalLine(C, xAxis) → fOrthogonalLine(B, xAxis) → gOrthogonalLine(E, xAxis) → hIntersect(e, yAxis) → FIntersect(c, e) → D'Intersect(d, c) → A'Intersect(f, c) → C'Intersect(g, c) → B'Intersect(h, c) → E'Segment(A, A') → iSegment(D', D) → jSegment(C', C) → kSegment(B, B') → lSegment(E', E) → m_1
AI Drawing Prompt Reference
Draw a set of data points and a straight line, then show perpendicular segments from each point to the line, with their feet on the x-axis and the line itself. Connect the feet to the original points using intersecting lines, forming multiple segments to visualize how adjusting the line affects the sum of squared errors, suitable for exploring linear regression and hypothesis testing.
The prompt above was compiled from the original drawing commands and is for reference only.