
Exploration of Exponential Functions
Loading the math board and drawing, please wait…
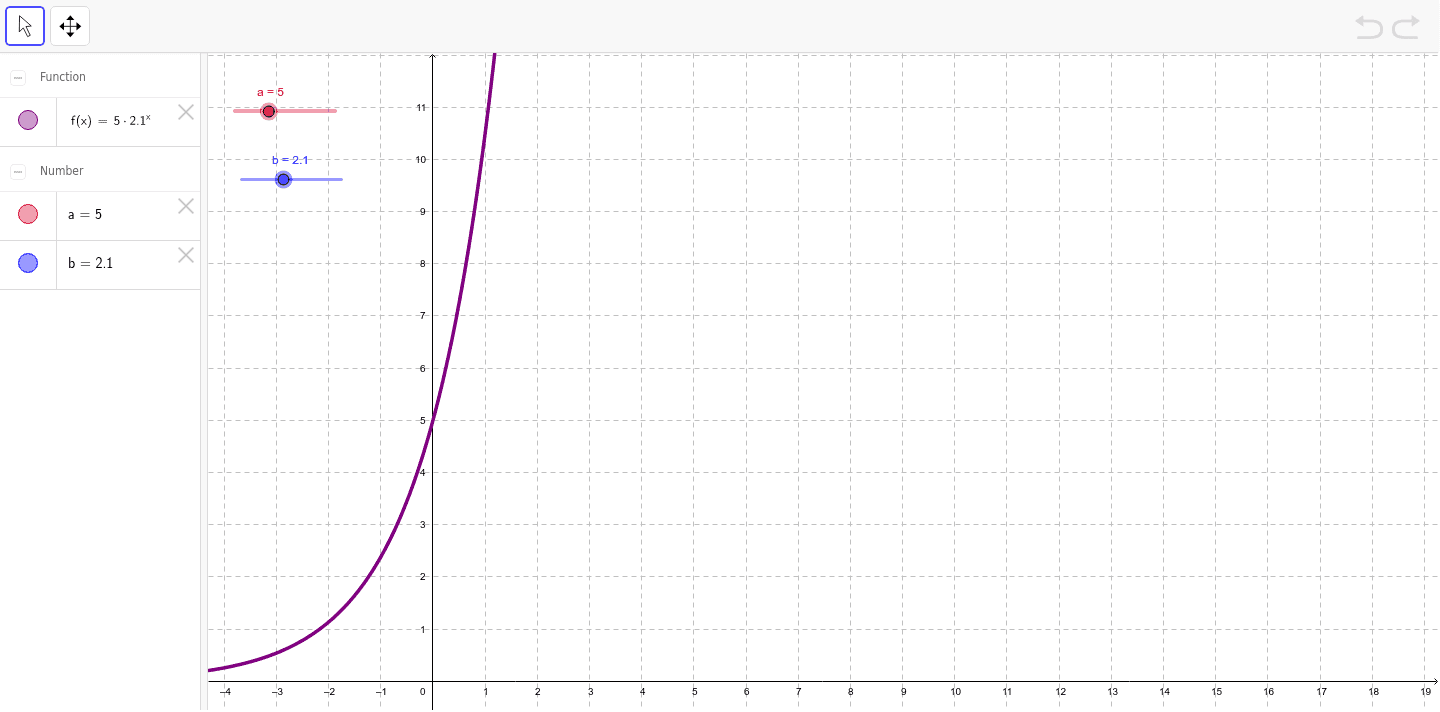
This example uses sliders to adjust the values of a and b, helping beginners explore the properties of exponential functions. It involves the core mathematical concept of exponential functions. By adjusting the values of a and b, one can observe changes in the graph of the exponential function. This example uses GeoGebra sliders and is suitable for middle school and above students for function graph exploration and understanding.
GeoGebra Commands & Parameters
Numeric a(5.0)Numeric b(2.1)f(x) = a * b^(x)
AI Drawing Prompt Reference
Draw an exponential function graph with a value of 5.0 for a and 2.1 for b. Observe how the graph changes by adjusting the values of a and b.
The prompt above was compiled from the original drawing commands and is for reference only.