
Exploration 3.8
Loading the math board and drawing, please wait…
In collections
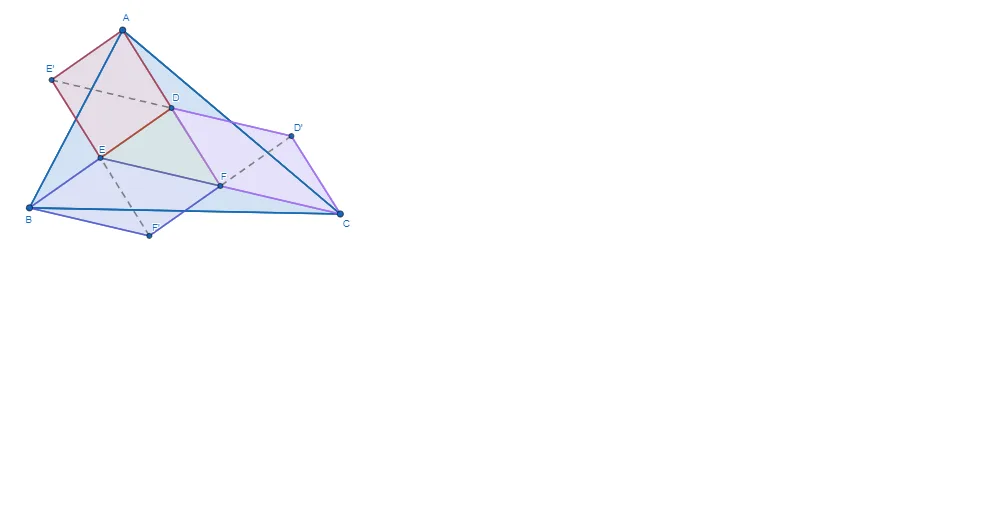
Exploring Feyman's Triangle
This example demonstrates the relationship between random variables and the hypergeometric distribution. By constructing random samples, it shows the probability distribution graph of the hypergeometric distribution. Commands used include Segment, Dilate, Intersect, Polygon, Rotate, etc., suitable for high school probability and statistics courses.
GeoGebra Commands & Parameters
Segment(A, B) → fSegment(C, B) → gSegment(A, C) → hDilate(C, 1 / 3, A) → C'Dilate(A, 1 / 3, B) → A'Dilate(B, 1 / 3, C) → B'Segment(B, C') → iSegment(A, B') → jSegment(A', C) → kIntersect(k, i) → EIntersect(j, i) → DIntersect(k, j) → FPolygon(B, A, C) → t1, c, b, aPolygon(E, D, F) → t2, f_1, d, eDilate(B, 1 / 2, A) → XDilate(A, 1 / 2, C) → YDilate(B, 1 / 2, C) → ZPolygon(X, E, B) → t3, b_1, x_1, d_1Polygon(Z, F, C) → t4, c_1, z_1, f_2Polygon(D, A, Y) → t5, y_1, e_1, a_1Rotate(X, (-(180°)), X) → X'Rotate(E, (-(180°)), X) → D'Rotate(B, (-(180°)), X) → B'_1Polygon(X', D', B'_1) → t3', b'_1, x', d'Rotate(D, (-(180°)), Y) → E'Rotate(A, (-(180°)), Y) → A'_1Rotate(Y, (-(180°)), Y) → Y'Polygon(E', A'_1, Y') → t5', y', e', a'_1Rotate(Z, (-(180°)), Z) → Z'Rotate(F, (-(180°)), Z) → F'Rotate(C, (-(180°)), Z) → C'_1Polygon(Z', F', C'_1) → t4', c'_1, z', f'Polygon(E, D', A, D) → q1, d_2, l, a_2, e_2Polygon(B, E, F, F') → q2, b_2, d_3, f_3, mPolygon(F, D, E', C) → q3, f_4, e_3, n, c_2Segment(D', D) → pSegment(E', F) → qSegment(F', E) → r
AI Drawing Prompt Reference
Draw a large triangle. Inside it, construct a smaller triangle by connecting points that divide each side into thirds. Then, rotate each of the three corner triangles 180 degrees around the midpoint of the opposite side, creating a symmetric pattern. Finally, connect corresponding points with line segments and shade the resulting polygonal regions to illustrate the geometric relationship in a probability distribution.
The prompt above was compiled from the original drawing commands and is for reference only.