
Explaining Derivative
Loading the math board and drawing, please wait…
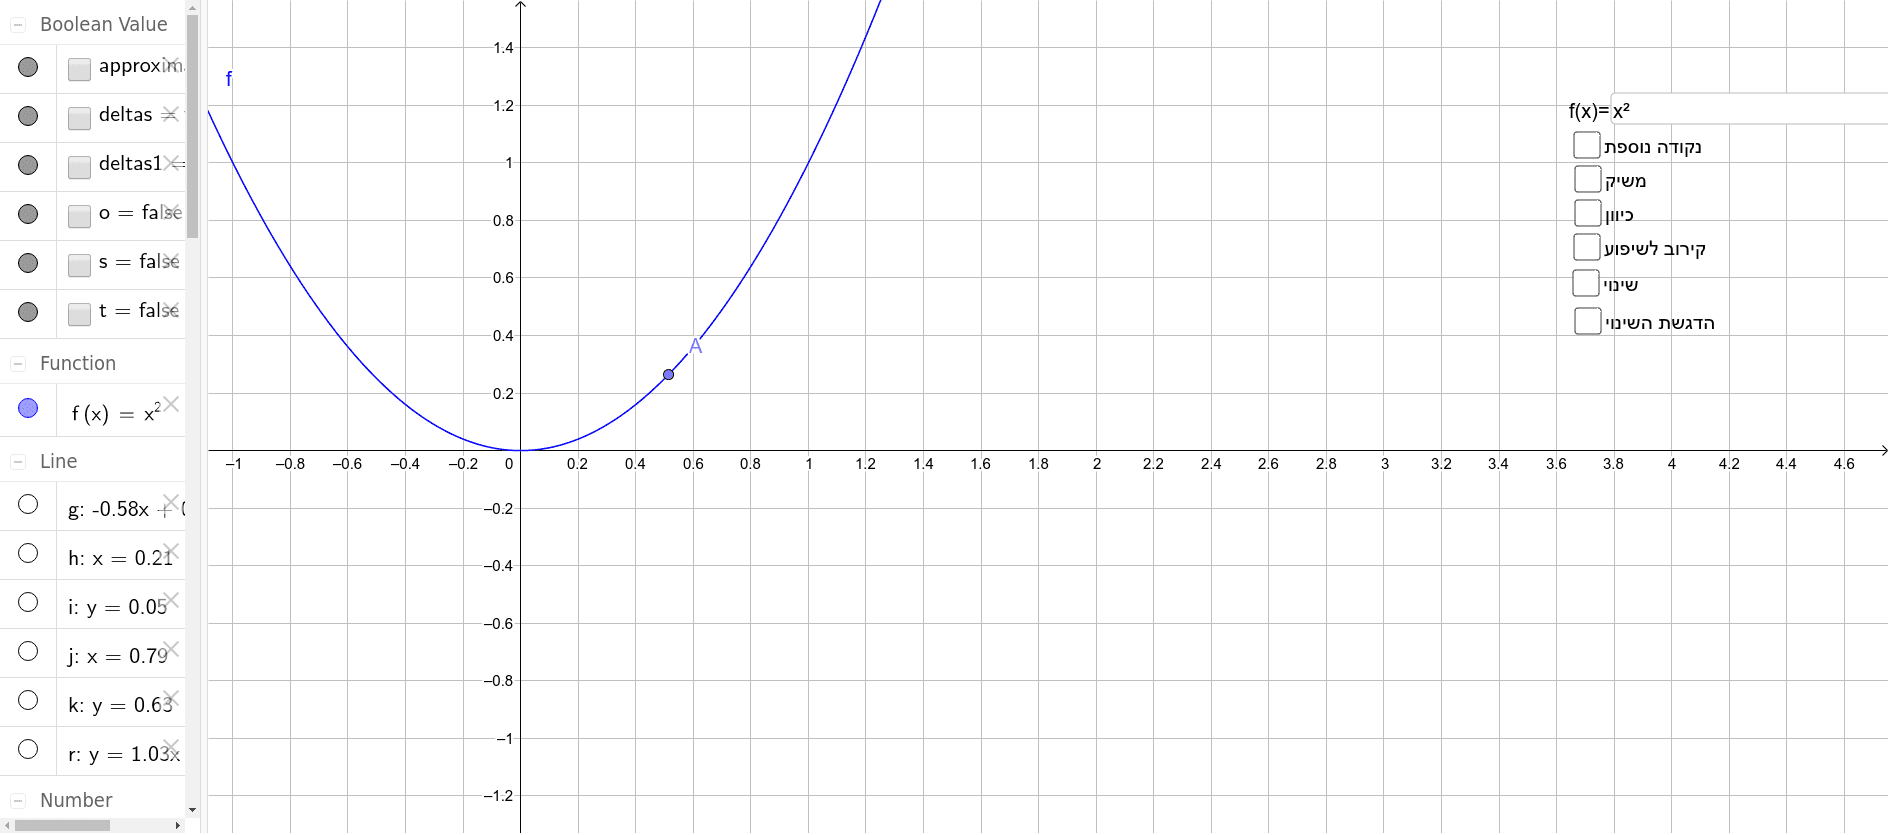
This example explains the concept of derivative through geometric figures. It shows the slope of the tangent line at a point on a function, which is the derivative value at that point. Using commands from the construction summary, it involves points, tangents, and slopes. Suitable for high school math education and learning about derivatives.
GeoGebra Commands & Parameters
Point(f) → COrthogonalLine(C, xAxis) → jPoint(f) → BOrthogonalLine(B, yAxis) → iIntersect(i, j) → HVector(H, C) → wVector(B, H) → vPoint(f) → ALine(B, C) → gOrthogonalLine(B, xAxis) → hOrthogonalLine(C, yAxis) → kIntersect(k, yAxis) → DIntersect(i, yAxis) → EIntersect(h, xAxis) → FIntersect(j, xAxis) → GSegment(E, D) → dySegment(F, G) → dxSegment(E, B) → lSegment(D, C) → mSegment(F, B) → nSegment(G, C) → pIntersect(h, k) → ISegment(C, B) → qTangent(A, f) → rPoint(r) → JVector(A, J) → uPoint(r) → MSlope(r) → m_1Polygon(E, D, C, B) → poly1, e, d, c, bPolygon(F, B, C, G) → poly2, f_1, b_1, c_1, g_1Textfield(f) → InputBox1
AI Drawing Prompt Reference
Draw a function curve and show the tangent line at a point on the curve, with the slope of the tangent representing the derivative at that point. Use geometric figures to explain the concept of the derivative, including perpendicular segments to the x-axis and y-axis through the point of tangency, and geometric shapes formed by these segments. Start with the function curve and tangent line, then add auxiliary line segments and shapes, and finally label key points and segments to clearly illustrate the geometric interpretation of the derivative.
The prompt above was compiled from the original drawing commands and is for reference only.