
Exercise 4.10: Continuity Graphic Practice
Loading the math board and drawing, please wait…
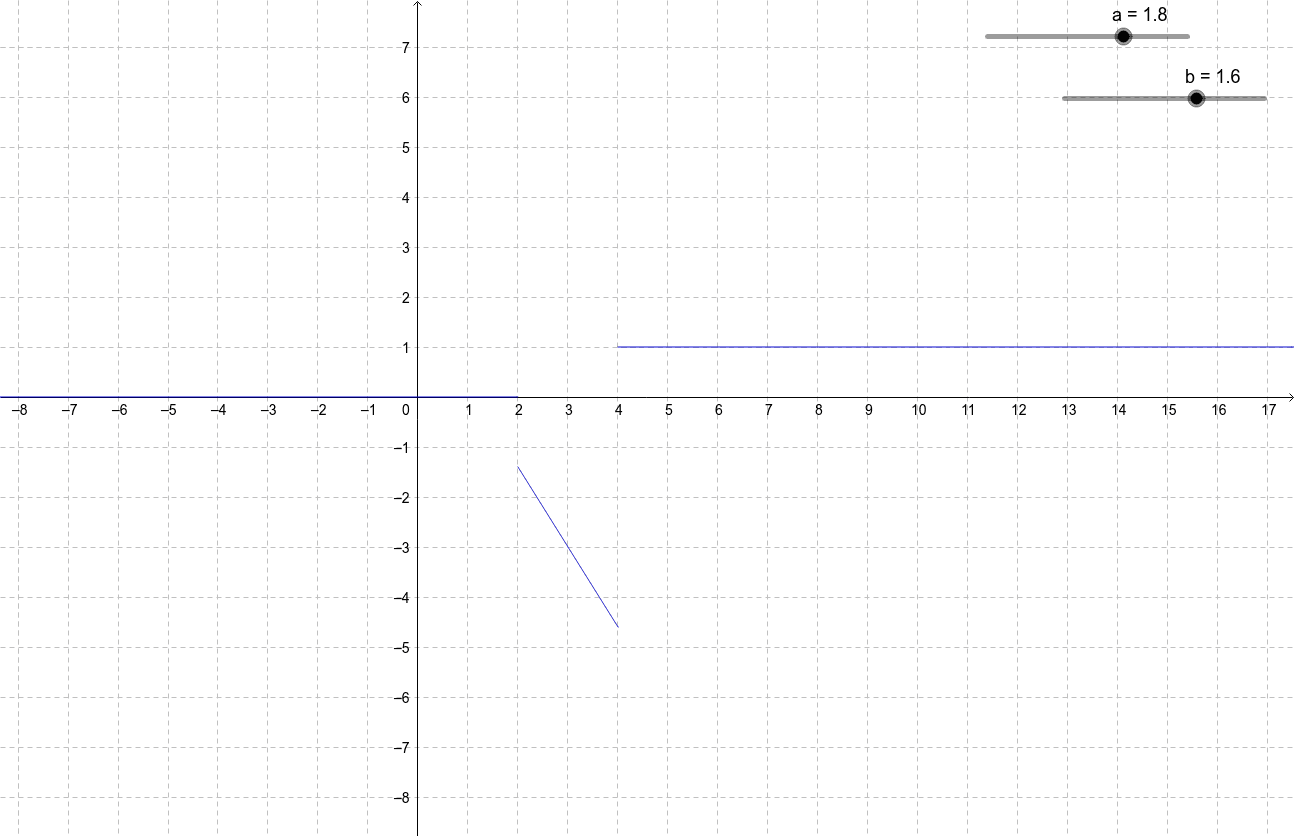
This example demonstrates the concept of continuity through graphical exercises. Users can construct functions f, g, and h using GeoGebra commands to observe their continuity properties. Suitable for high school mathematics education, particularly in calculus and function continuity.
GeoGebra Commands & Parameters
Function(0, -1000, 2) → fFunction(a - (b * x), 2, 4) → gFunction(1, 4, 1000) → h
AI Drawing Prompt Reference
Draw a constant function f with value 0. Draw a linear function g with a slope of -1 from x=2 to x=4. Draw a constant function h with value 1. Observe the continuity of these three functions.
The prompt above was compiled from the original drawing commands and is for reference only.