
Examine Continuity of Piecewise Function
Loading the math board and drawing, please wait…
In collections
Calculus C01_Limits&Their Properties
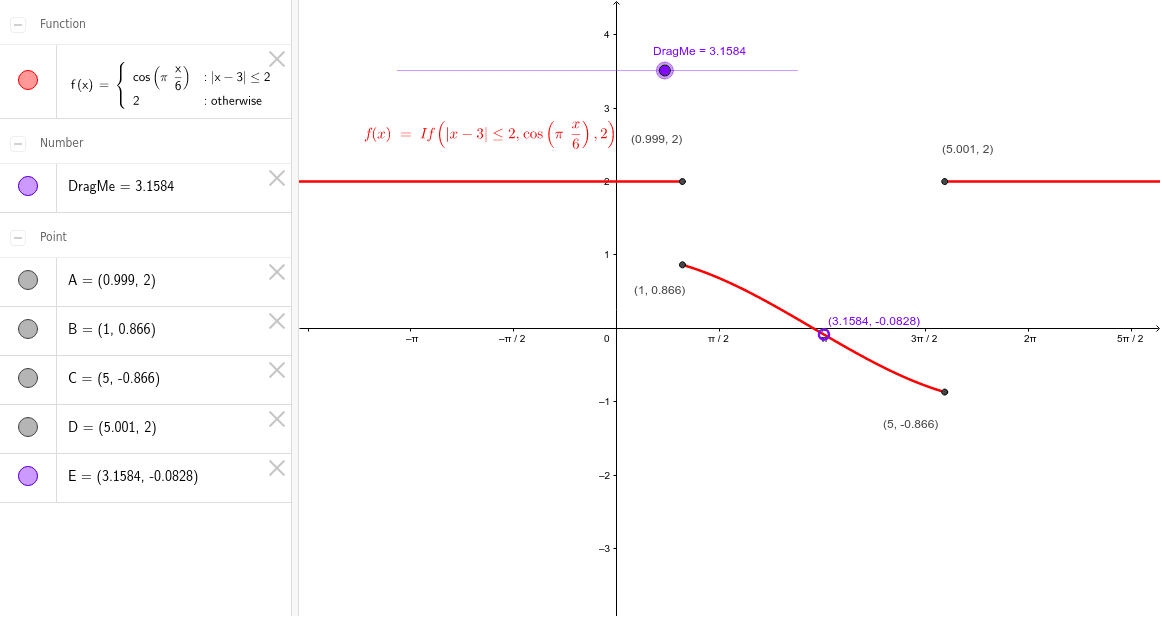
This example demonstrates how to use GeoGebra to explore the continuity of piecewise functions. It visually illustrates the concept of continuity and discontinuity across different intervals of a function. Key math concepts involved include function definition, continuity tests, limits, and curve sketching. The construction uses GeoGebra commands like If and objects such as f, A, D, B, C, DragMe, E to dynamically adjust and display the function's graph and critical features. Suitable for high school and introductory college calculus students learning about function analysis.
GeoGebra Commands & Parameters
If(abs(x - 3) ≤ 2, cos(π * x / 6), 2) → f
AI Drawing Prompt Reference
Draw the graph of a piecewise function where the value is cos(πx/6) when x is between 1 and 5, and 2 otherwise, highlighting the discontinuity at x=3. Allow dynamic adjustment of the x-range to observe continuity and discontinuity.
The prompt above was compiled from the original drawing commands and is for reference only.