
Euler's Method by Stephen Newbigging
Loading the math board and drawing, please wait…
In collections
BC Calculus
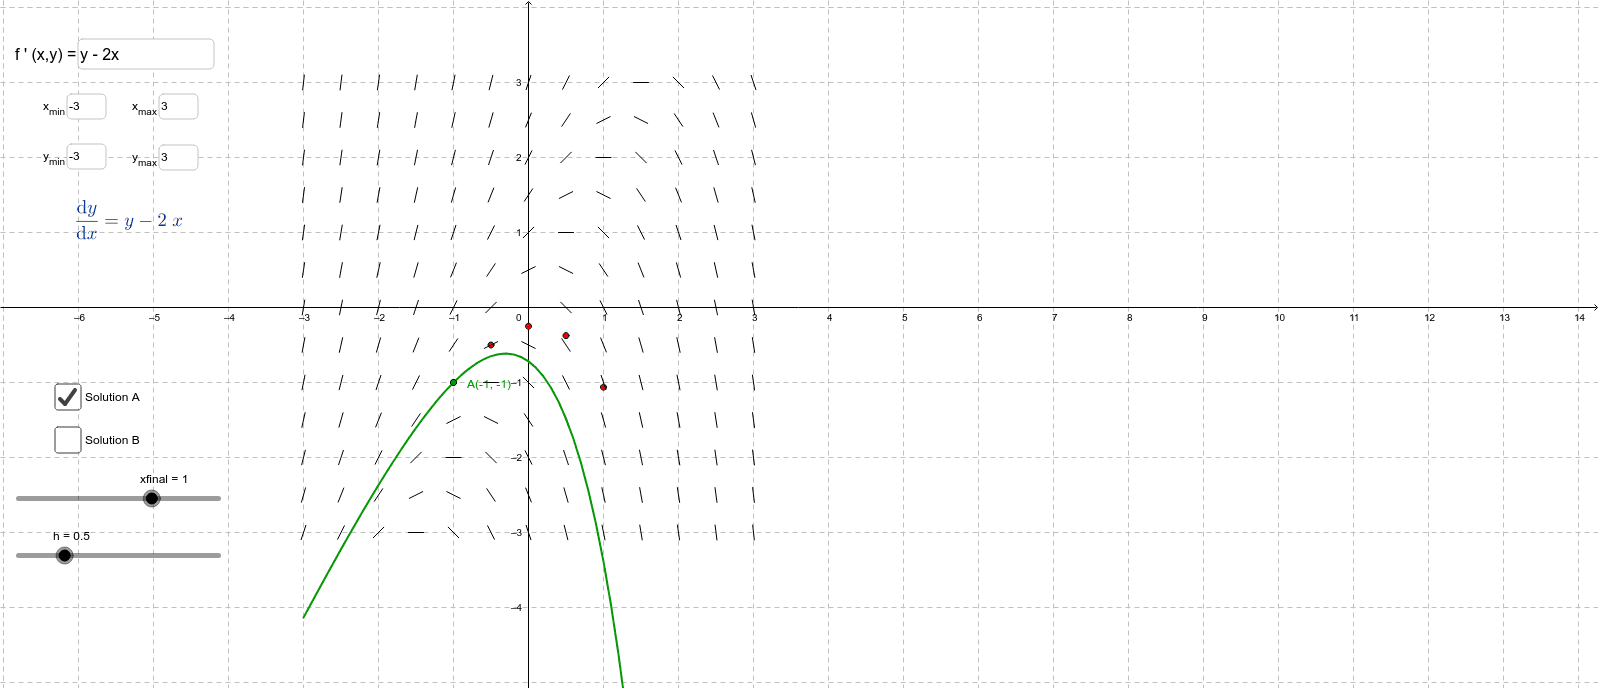
This example demonstrates Euler's method overlaid on the actual solution. Euler's method is a numerical method for solving differential equations. By constructing the commands listed in the summary, one can observe how to use GeoGebra to draw the graph of Euler's method. This example is suitable for high school mathematics education, particularly for learning calculus and numerical methods.
GeoGebra Commands & Parameters
Textfield(f) → inputBox1Textfield(x_{min}) → inputBox2Textfield(x_{max}) → inputBox3Textfield(y_{min}) → inputBox4Textfield(y_{max}) → inputBox5SlopeField(f, num, L, x_{min}, y_{min}, x_{max}, y_{max}) → slopefield1Textfield(delta) → inputBox6SolveODE(f, x(A), y(A), x_{max}, delta) → numericalIntegral1SolveODE(f, x(A), y(A), (-x_{max}), delta) → numericalIntegral2SolveODE(f, x(B), y(B), x_{max}, delta) → numericalIntegral3SolveODE(f, x(B), y(B), x_{min}, delta) → numericalIntegral4Sequence((Element[tList, w], Element[yList, w]), w, 1, np + 1) → eulerpts
AI Drawing Prompt Reference
Draw the Euler method approximation of a function's solution alongside the actual solution curve. First, set the minimum and maximum values for x and y. Then, plot the slope field. Next, input the initial point and step size, and use the Euler method to solve the differential equation from both positive and negative maximum x values, resulting in numerical integration curves. Finally, generate a series of points using the Euler method and connect them to form the approximation lines.
The prompt above was compiled from the original drawing commands and is for reference only.