
Euler Formula Visualization: Complex Exponential and Unit Circle
Loading the math board and drawing, please wait…
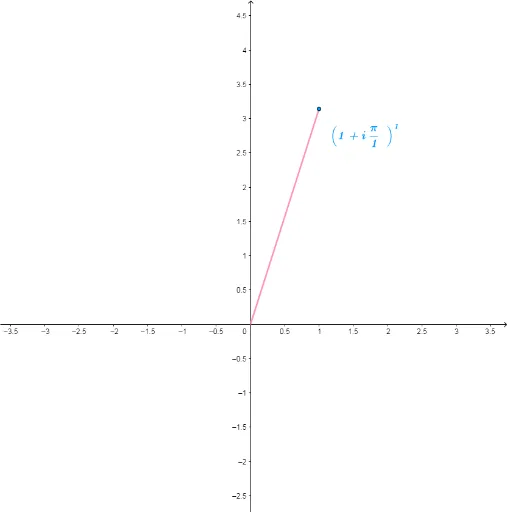
This GeoGebra example dynamically visualizes Euler's formula e^(iθ) = cosθ + i·sinθ. It constructs a unit circle using a semicircle and line segments, mapping the complex exponential to points on the circle, showing that the real part corresponds to cosine and the imaginary part to sine. Core mathematical concepts include complex numbers, Euler's formula, trigonometric functions, and the unit circle. Construction details: the Semicircle command draws the semicircle, Segment connects key points, and buttons (button1, button2) control animation or toggling displays. Objects include points A, B, O, complex numbers z_1 and z_3, and texts text1 through text6 for labeling formulas and values. Suitable for high school to university students learning complex numbers and trigonometric identities, as well as for teaching connections between exponential and trigonometric functions in calculus.
GeoGebra Commands & Parameters
Semicircle(B, A) → cSegment(O, z_3) → f