
Epitrochoid Parametric Curve Demo
Loading the math board and drawing, please wait…
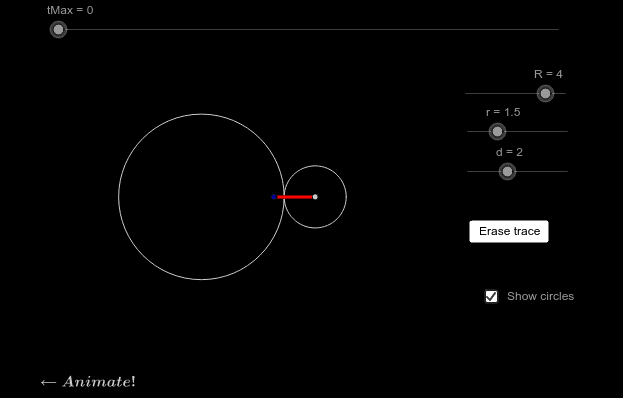
This example demonstrates the generation process of an epitrochoid through animation, showing the dynamic changes in the path traced by a moving point as it rotates around a circle. Key mathematical concepts involved include parametric equations, trigonometry, coordinate geometry, and geometric transformations. The construction leverages GeoGebra commands such as CurveCartesian (for Cartesian curves), Intersect (for intersections), Circle (to create circles), and Segment (for line segments), utilizing objects like R, r, d, f, g, tMax, k, A, c, P, e, Q, a, button1, b, h, and text1. It is suitable for high school and above students to understand the application of parametric equations and the generation of geometric loci, as well as for educational demonstrations.
GeoGebra Commands & Parameters
CurveCartesian(f(t), g(t), t, 0, tMax) → kIntersect(xAxis, yAxis) → ACircle(A, R) → cCircle(P, r) → eSegment(P, Q) → aSegment(P, Q) → b
AI Drawing Prompt Reference
Draw a dynamic parametric curve showing the path traced by a point moving around a circle. Include two circles and their intersection with an axis, a point moving on one circle leaving a trace, another point fixed on the circle, and line segments connecting the two points to illustrate the locus formation.
The prompt above was compiled from the original drawing commands and is for reference only.