
Energy Diagrams 7
Loading the math board and drawing, please wait…
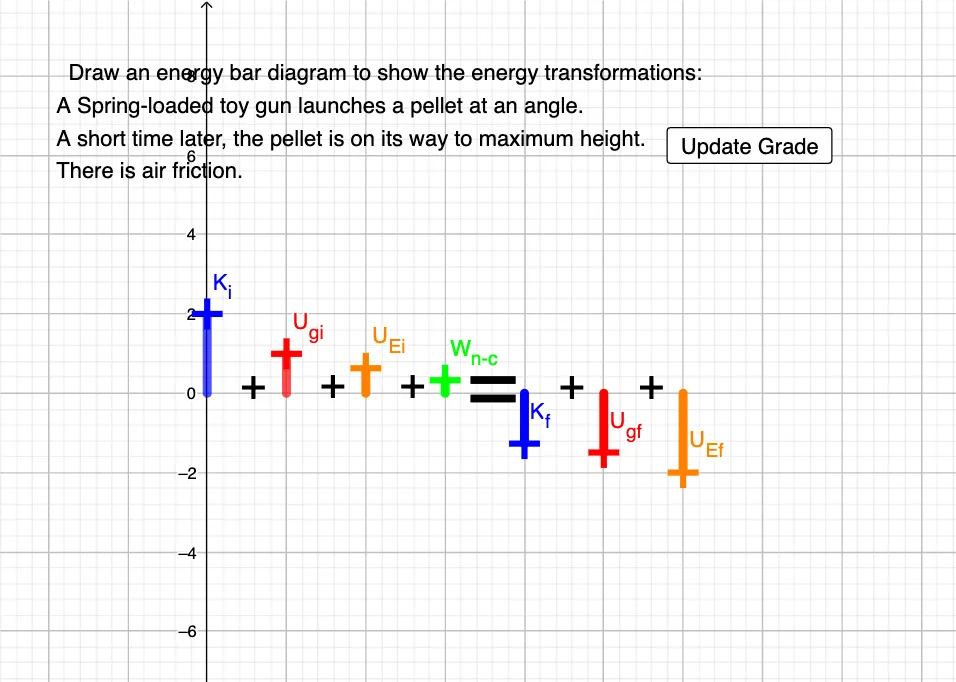
This example demonstrates the construction of energy diagrams, involving the concept of derivatives in calculus. Using GeoGebra commands such as Line, Point, Intersect, etc., key elements of the energy diagram are constructed. Suitable for high school and above students to learn about energy changes and calculus applications.
GeoGebra Commands & Parameters
Line(O, yAxis) → pPoint(p) → U_{Ef}Point(yAxis) → CLine(C, yAxis) → fLine(F, f) → hPoint(h) → U_{gi}Point(f) → K_iLine(G, f) → iPoint(i) → U_{Ei}Line(H, f) → jPoint(j) → W_{n-c}Line(M, yAxis) → mPoint(m) → K_fLine(N, yAxis) → nPoint(n) → U_{gf}Intersect(xAxis, yAxis) → APoint(Circle[A, 1]) → BLine(D, E) → gIntersect(f, xAxis) → IIntersect(h, xAxis) → JIntersect(i, xAxis) → KIntersect(j, xAxis) → LSegment(K_i, I) → kSegment(U_{gi}, J) → lSegment(U_{Ei}, K) → Kf_1Segment(W_{n-c}, L) → Ugf_1If(-0.1 < y(K_i) < 0.1, true, false) → KiCheckIf(-0.1 < deltaE < 0.1, true, false) → deltaECheckIf(y(K_f) > 0, true, false) → KfCheckSegment(M, K_f) → qSegment(N, U_{gf}) → rSegment(O, U_{Ef}) → sIf(y(W_{n-c}) < 0, true, false) → WncCheckIf(y(U_{Ei}) > 0, true, false) → UeiCheckIf(y(U_{gf}) > y(U_{gi}), true, false) → UgfCheckIf(KfCheck ∧ KiCheck ∧ deltaECheck ∧ WncCheck ∧ UeiCheck ∧ UgfCheck, 1, 0) → grade
AI Drawing Prompt Reference
Draw an energy diagram with a curve f representing potential energy, and its intersections with the x-axis at points I, J, K, and L, indicating energy changes. Place points U_Ef, U_Ei, U_gf, U_gi, K_i, K_f, and W_nc on the y-axis to represent different energy states and transitions. Connect these points and the curve to form the various parts of the energy diagram, ensuring that curve f intersects the x-axis at point I, and J, K, and L correspond to the projections of U_gi, U_Ei, and W_nc, respectively.
The prompt above was compiled from the original drawing commands and is for reference only.