
Energy Diagrams 6
Loading the math board and drawing, please wait…
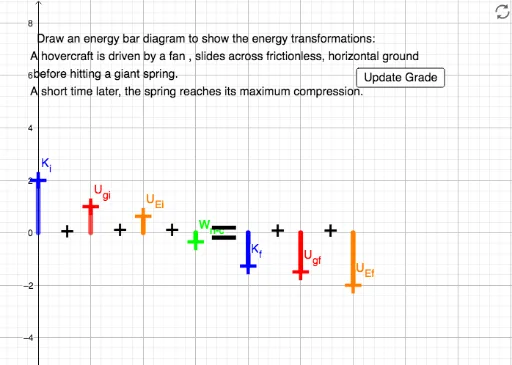
This example demonstrates energy diagrams, involving quadratic functions and scatter plots. Using GeoGebra commands such as Line, Point, Intersect, etc., a dynamic model of energy diagrams can be constructed. Suitable for high school physics and mathematics education.
GeoGebra Commands & Parameters
Line(O, yAxis) → pPoint(p) → U_{Ef}Point(yAxis) → CLine(C, yAxis) → fLine(F, f) → hPoint(h) → U_{gi}Point(f) → K_iLine(G, f) → iPoint(i) → U_{Ei}Line(H, f) → jPoint(j) → W_{n-c}Line(M, yAxis) → mPoint(m) → K_fLine(N, yAxis) → nPoint(n) → U_{gf}Intersect(xAxis, yAxis) → APoint(Circle[A, 1]) → BLine(D, E) → gIntersect(f, xAxis) → IIntersect(h, xAxis) → JIntersect(i, xAxis) → KIntersect(j, xAxis) → LSegment(K_i, I) → kSegment(U_{gi}, J) → lSegment(U_{Ei}, K) → Kf_1Segment(W_{n-c}, L) → Ugf_1If(y(K_i) > 0, true, false) → KiCheckIf(-0.1 < deltaE < 0.1, true, false) → deltaECheckIf(-0.1 < y(K_f) < 0.1, true, false) → KfCheckSegment(M, K_f) → qSegment(N, U_{gf}) → rSegment(O, U_{Ef}) → sIf(y(W_{n-c}) > 0, true, false) → WncCheckIf(y(U_{Ef}) > 0, true, false) → UefCheckIf(KfCheck ∧ KiCheck ∧ deltaECheck ∧ WncCheck ∧ UefCheck, 1, 0) → grade
AI Drawing Prompt Reference
Draw an energy diagram with coordinate axes and a vertical reference line. Place an initial potential energy point on the reference line)Skip a reference point on the y-axis and draw a horizontal line through it. From the reference point, draw a vertical line to intersect the horizontal line, marking the initial gravitational potential energy point. On the horizontal line, place the initial kinetic energy point, then draw vertical lines to get the initial elastic potential energy point and the non-conservative work point. On the y-axis, place the final kinetic energy and final gravitational potential energy points, and draw horizontal lines through them. Mark the origin, draw a unit circle, and pick a point on it. Connect relevant points with segments to show energy changes. Finally, check conditions based on point positions and give a score.
The prompt above was compiled from the original drawing commands and is for reference only.