
Emma's Math Geo BoxPlot
Loading the math board and drawing, please wait…
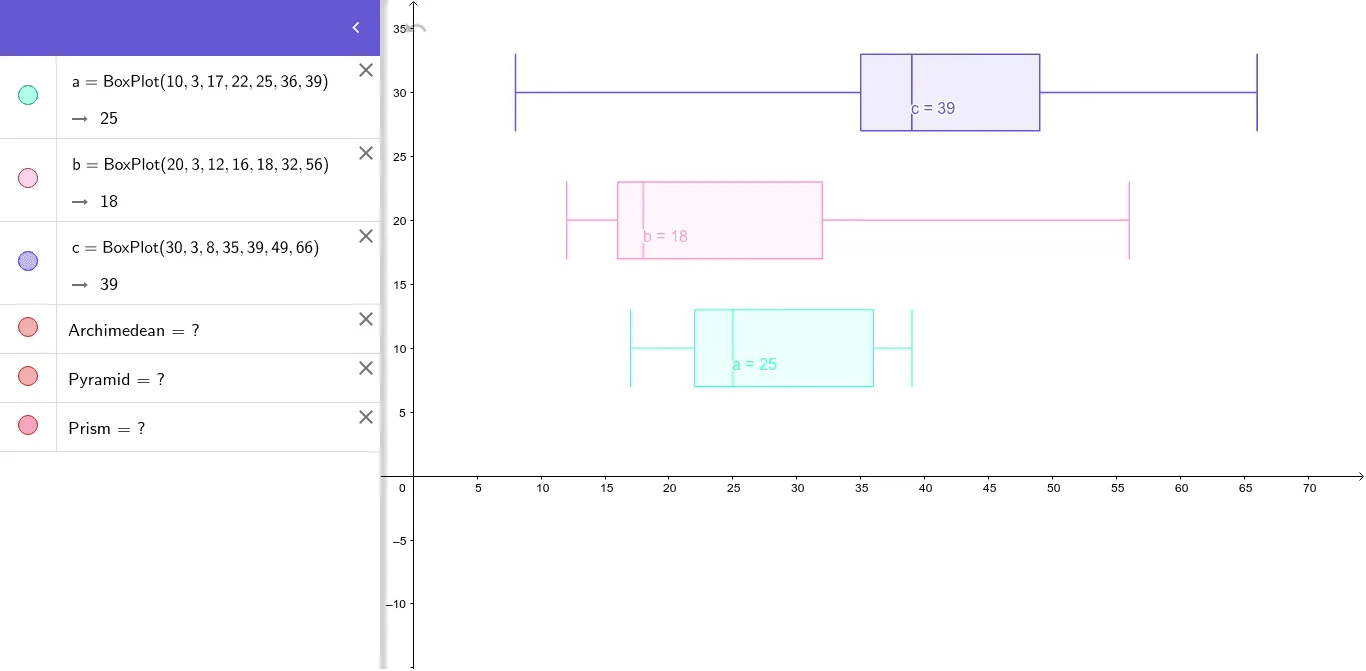
This example demonstrates how to create a box plot using GeoGebra for visualizing data distribution. Core math concepts involved include Probability & Statistics, Hypothesis Testing, and Data Visualization. Key construction points involve using the BoxPlot command and objects like a, b, c for data representation. Suitable for high school and above students to learn about data distribution characteristics.
GeoGebra Commands & Parameters
BoxPlot(10, 3, 17, 22, 25, 36, 39) → aBoxPlot(20, 3, 12, 16, 18, 32, 56) → bBoxPlot(30, 3, 8, 35, 39, 49, 66) → c