
Ehrenfest's model (advanced)
Loading the math board and drawing, please wait…
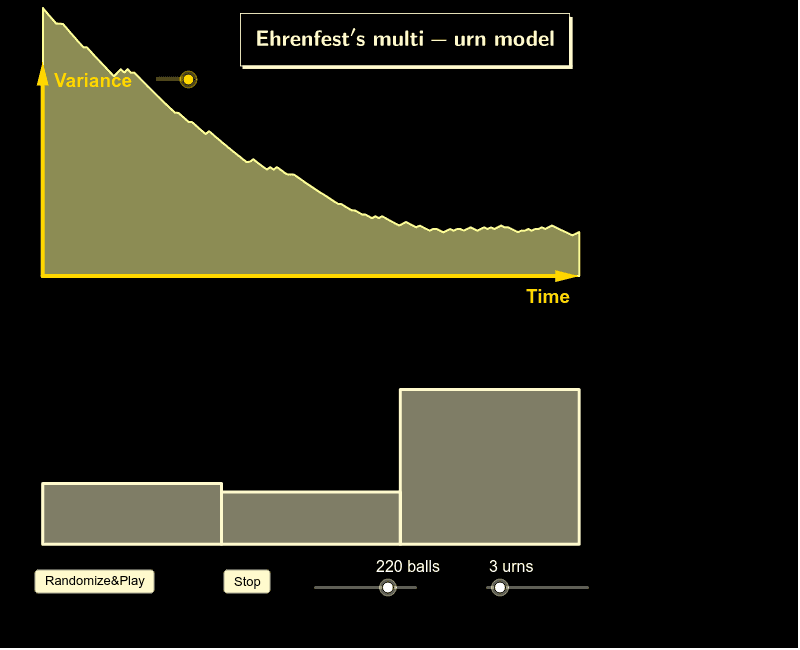
Ehrenfest's model, proposed by Tatiana and Paul Ehrenfest in the early 1900s, is a simple yet powerful statistical model. This example demonstrates a multi-urn realization using GeoGebra commands like Sum, Random, Sequence, BarChart, Vector, and IntegralBetween, illustrating core mathematical concepts in probability & statistics such as variance, correlation, and standard deviation. Key construction elements include Sum for total calculation, Random for generating random numbers, Sequence for creating series, BarChart for plotting histograms, Vector for vector representation, and IntegralBetween for integral computation. Suitable for high school and above students to explore applications in probability & statistics.
GeoGebra Commands & Parameters
Sum(nums) → sumRandom(1, n) → iNumSequence(Sum[Take[nums, 1, k]], k, 1, m) → sumsSequence(m) → tmpBarChart(0, 10, scale * nums / n) → barsVector((0, 5), (10, 5)) → uVector((0, 5), (0, 9)) → vIntegralBetween(Function[Join[{{0, 10}, If[w ≟ 1, 2 * dataS + scale, 5 * dataσ / Max[dataσ] + scale]}]], 5, 0, 10) → var
AI Drawing Prompt Reference
Draw a statistical model showing the random movement of balls in multiple urns, with a bar chart representing the distribution of balls in each urn, and vectors and an integral area indicating variance. Start with the bar chart, add vectors showing direction and range, and finally highlight the variance with an integral area.
The prompt above was compiled from the original drawing commands and is for reference only.