
Effect of Parameter Changes on a Function
Loading the math board and drawing, please wait…
In collections
Geom. & Alg.: Quadratics
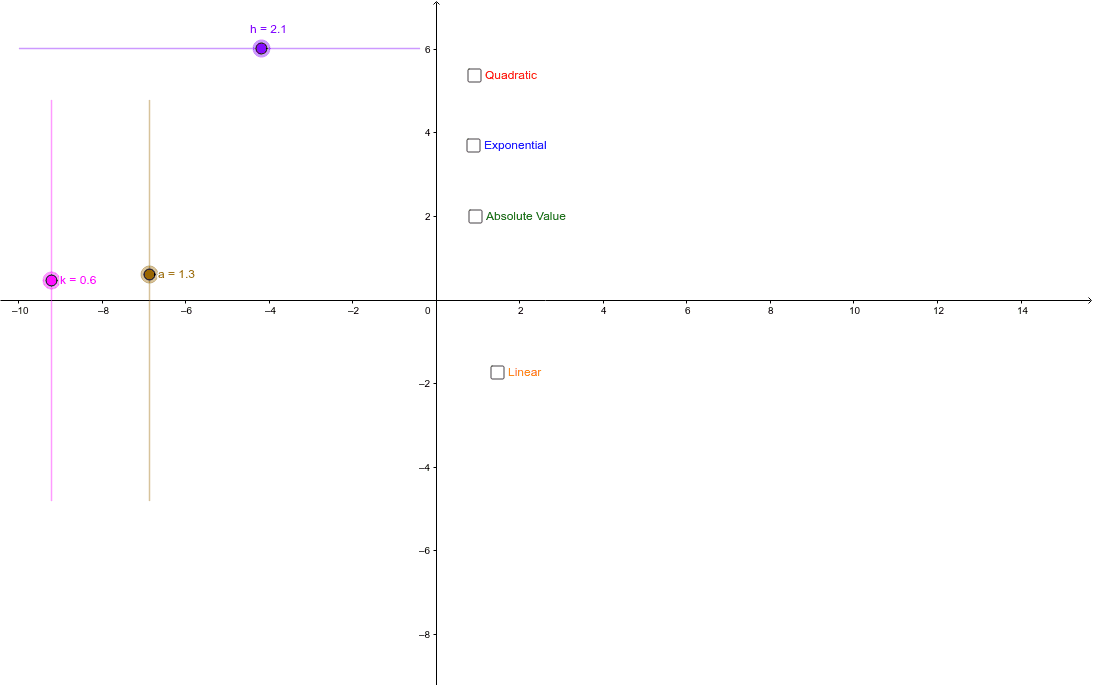
This example demonstrates how altering parameters a, k, h affects the graph of a function f(x). It covers core math concepts like function graph transformations and the role of parameters. Constructed using GeoGebra's slider animation for parameter control, involving objects like function f, texts text1-12, and variables a-k. Ideal for high school mathematics teaching to understand transformations like shifts and stretches of function graphs.
GeoGebra Commands & Parameters
LaTeX(f) → text1LaTeX(g) → text6LaTeX(j) → text9LaTeX(m) → text12
AI Drawing Prompt Reference
Draw a function graph to show the effect of parameter changes on the function. Use sliders to control parameters a and k, and observe the translation and scaling of the function graph as the parameters change. Plot the functions f(x) and g(x) in the coordinate system, and label the key parameters and function expressions to explain how parameters affect the position and shape of the function graph, suitable for teaching function transformations.
The prompt above was compiled from the original drawing commands and is for reference only.