
Effect of Extreme Values on 1-Variable Statistics
Loading the math board and drawing, please wait…
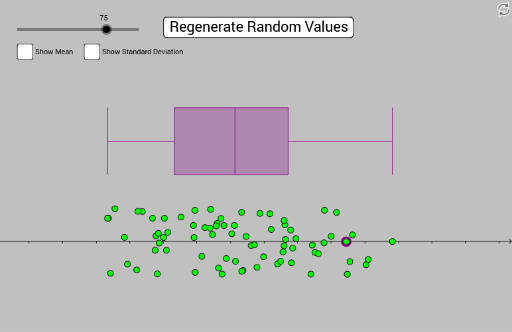
This example demonstrates how extreme values affect one-variable statistical measures, particularly standard deviation. It involves core concepts like statistics, function graphing, rhombus, triangles, similar triangles, and hypergeometric distribution. The construction uses GeoGebra commands such as Point, Sequence, Append, BoxPlot, Segment, and Polygon. Suitable for high school and above, it helps learners understand the relationship between data distribution and statistical indicators.
GeoGebra Commands & Parameters
Point(xAxis) → ASequence(RandomNormal[0, 1], k, 1, N) → list1Append({(-1.1104960221269111, 0.08574072492174134), (-1.8190365233188575, 0.3508333515047224), (-0.20007037183328683, 0.27120198937705575), (0.796789486291938, -0.06128570256733745), (-1.7871325027493998, -0.47208708813269296), (-0.30438280954545494, 0.20143882730279106), (-1.5349371476227247, -0.33602737632801327), (2.4104611407616883, 0.002525301372311217), (0.7009937402612261, -0.33382952947805855), (-0.38144191430055935, 0.2100260980316001), (0.7456328591588697, -0.29333533871561634), (0.5866276880997935, 0.416472959615641), (1.7383390004760935, -0.4867554413923473), (0.30730393629983116, -0.057961671859986685), (-0.2688653424527746, 0.1057705761191402), (0.8099180946577149, 0.2509472317943202), (0.18523441394410475, -0.42966913885376634), (0.8180176305957311, 0.03324596353693854), (-0.7387416676314755, 0.36784948459777045), (1.392352819939226, -0.017646559896873693), (2.0175307521184993, -0.34467383564177534), (2.0509510078622952, -0.2666084852201749), (-0.2112142330571661, 0.23558237689007244), (-1.0908831492388904, -0.48188907484080545), (0.9740307933621483, 0.045335000862474106), (1.2583974948167107, -0.16070007184562984), (-0.5274764282424854, -0.4583871450486521), (-0.9544643337986605, -0.1291173189803848), (0.35782089272876605, -0.047022471309817515), (-0.9851464741726335, 0.34948533556161276), (-1.074875394403061, 0.12470498877654823), (0.16503216308460433, 0.43906716446755145), (-0.17808624803942025, -0.3939701598450719), (0.4384062200805528, 0.4222856782084602), (1.7768218078279832, -0.29725089865470455), (1.8162428097076782, 0.10058356680931402), (-1.3146547127957815, 0.44992821326984866), (1.3992177742958714, 0.4695565836136919), (0.7813407531939855, -0.15285301808956075), (-1.39704243625944, -0.4230181747510471), (-0.5520806698932105, 0.24266824098315598), (-0.5306609827476495, 0.46795520861452267), (-1.3792983737808282, 0.45310792669996747), (0.49313522016916184, -0.2250914198735856), (-0.9969680934541406, 0.06163023916444843), (1.3078802914851013, -0.18015392391371587), (-1.8309413617288444, 0.3503864435832549), (-0.5435885054600312, 0.0619603625364048), (-1.721822009766407, 0.4918623379995758), (-0.14303170648077607, 0.345859461598112), (1.2175834773270946, -0.05100679396401364), (0.9061554846561231, -0.31604489314469986), (1.1973125547541719, -0.48464793086934466), (-0.09824669639452485, 0.24113399263874902), (-1.5799267393348289, 0.06441044313202438), (-0.42699771406664994, -0.21934640693179097), (-1.122615508628326, -0.12918178172255823), (0.23186142098674276, 0.0772745009230914), (0.7985078985952866, 0.3168428070041739), (0.0735994188028798, -0.2930384069514387), (0.924992843260281, -0.09644614746580193), (0.6056670149770925, 0.18205654454442666), (-0.0641587645694172, -0.2509645963089828), (0.3933728271010155, -0.3833554731519919), (0.8960536794488793, 0.17485177798820883), (-1.063954594429376, -0.0210913371652659), (0.16707381784701628, -0.4428102766620369), (-0.12576762758814258, -0.4844147682143508), (-1.1621177370004039, 0.3505439701534332), (0.018574468312284213, 0.11820386265438221), (1.4981704683866632, 0.07950910351562146), (0.05732495965465117, 0.24161671744960078), (-0.9346312060916316, 0.1381857932811852), (-0.2966375358944505, 0.482391182906756), (1.5782038105752791, 0.4369047074928074)}, A) → dataBoxPlot(1.5, 0.5, x(data), true) → aSegment((MeanX[data], 1), (MeanX[data], 2)) → fPolygon((MeanX[data], 1), (MeanX[data] - SDX[data], 1.5), (MeanX[data], 2), (MeanX[data] + SDX[data], 1.5)) → poly1, g, h, i, j
AI Drawing Prompt Reference
Create a chart demonstrating the effect of extreme values on one-variable statistics. Draw a horizontal line to represent the mean, and add two vertical segments on it to indicate the standard deviation. Then, construct a rhombus above the mean line with vertices at the mean plus and minus the standard deviation. Finally, include a box plot with randomly generated normal distribution data to show the data distribution.
The prompt above was compiled from the original drawing commands and is for reference only.