
Effect of Coefficient Change on Function Graph
Loading the math board and drawing, please wait…
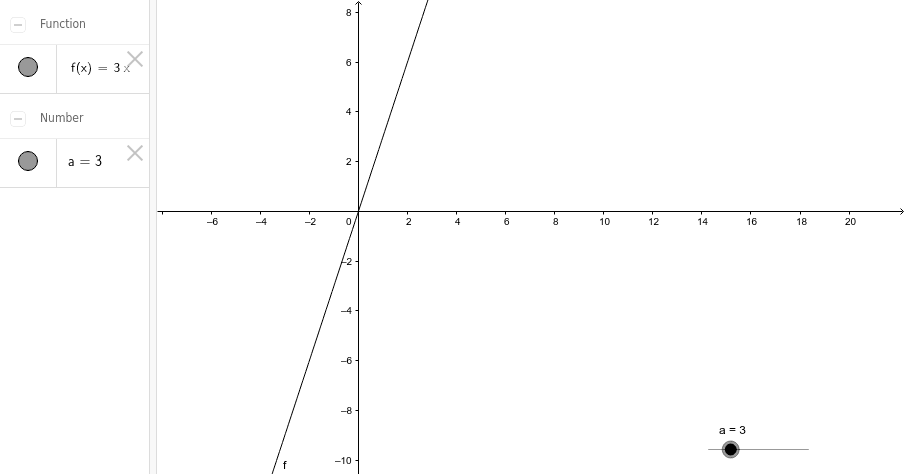
This example demonstrates how the graph of the function Y = AX changes as the coefficient A varies. The core mathematical concepts involved include the properties of function graphs and the impact of coefficients on the shape of the function. The construction highlights the use of a Slider to control the coefficient a and plot the function f(a*x). Suitable for high school students and teachers learning about the behavior of function graphs.
GeoGebra Commands & Parameters
Numeric a(3.0)f(x) = (a * x) + 0
AI Drawing Prompt Reference
Draw a function graph to show the effect of coefficient changes on the function. Use a slider to control the coefficient and plot the function f(a*x), observing how the graph changes as the coefficient a varies from 3.
The prompt above was compiled from the original drawing commands and is for reference only.