
Dynamic Visualization of Mean, Median, and Mode
Loading the math board and drawing, please wait…
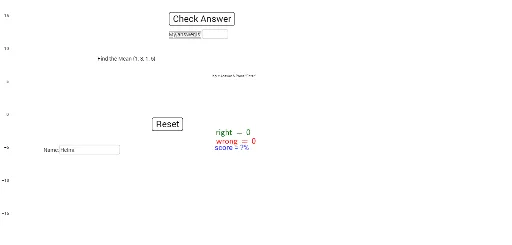
This GeoGebra example dynamically demonstrates the calculation and graphical representation of the mean, median, and mode for a set of random data. The core mathematical concepts are measures of central tendency in descriptive statistics, involving data sorting, frequency distribution, and multiple statistical charts such as stem-and-leaf plots, dot plots, and box plots. Construction highlights include using the Random command to generate data, Sum for total, and statistical functions like Median, Mode, Q1, Q3, Min, Max to extract key values, while StemPlot, DotPlot, and BoxPlot visualize the data distribution. Additionally, geometric objects like Circle, Rotate, Angle, and CircleSector are used to build a unit circle with angle representations, and Textfield with LaTeX input allows interactive parameter adjustment. This resource is suitable for middle and high school statistics lessons, helping students intuitively understand how different statistics describe data centrality and how outliers affect the mean versus the median.
GeoGebra Commands & Parameters
Random(1, 5) → B2Random(1, 5) → B3Random(1, 5) → B4Random(1, 5) → B5Sum(B2:B5) → B6Random(26, 29) → A11Random(26, 29) → A12Random(26, 29) → A13Random(26, 29) → A14Random(26, 29) → A15Random(26, 32) → A16Random(26, 33) → A17Random(29, 35) → B11Random(30, 35) → B13Random(30, 35) → B14Random(30, 35) → B16Random(30, 35) → B18Random(28, 35) → A18Random(29, 35) → B12Random(28, 35) → B15Random(28, 35) → B17Random(35, 42) → C11Random(35, 42) → C12Random(35, 42) → C13Random(35, 42) → C14Random(35, 42) → C15Random(35, 42) → C17Random(35, 42) → C18Random(37, 43) → D11Random(33, 43) → D12Random(37, 44) → D13Random(40, 44) → D14Random(40, 44) → D15Random(40, 44) → D16Random(40, 44) → D17Random(40, 43) → D18Random(35, 42) → C16StemPlot({A11, A12, A13, A14, A15, A16, A17, A18, B11, B12, B13, B14, B15, B16, B17, B18, C11, C12, C13, C14, C15, C16, C17, C18, D11, D12, D13, D14, D15, D16, D17, D18}) → text11DotPlot({A11, A12, A13, A14, A15, A16, A17, A18, B11, B12, B13, B14, B15, B16, B17, B18, C11, C12, C13, C14, C15, C16, C17, C18, D11, D12, D13, D14, D15, D16, D17, D18}) → list4BoxPlot(1, 1, {A11, A12, A13, A14, A15, A16, A17, A18, B11, B12, B13, B14, B15, B16, B17, B18, C11, C12, C13, C14, C15, C16, C17, C18, D11, D12, D13, D14, D15, D16, D17, D18}, true) → bQ3({A11, A12, A13, A14, A15, A16, A17, A18, B11, B12, B13, B14, B15, B16, B17, B18, C11, C12, C13, C14, C15, C16, C17, C18, D11, D12, D13, D14, D15, D16, D17, D18}) → iQ1({A11, A12, A13, A14, A15, A16, A17, A18, B11, B12, B13, B14, B15, B16, B17, B18, C11, C12, C13, C14, C15, C16, C17, C18, D11, D12, D13, D14, D15, D16, D17, D18}) → hMin({A11, A12, A13, A14, A15, A16, A17, A18, B11, B12, B13, B14, B15, B16, B17, B18, C11, C12, C13, C14, C15, C16, C17, C18, D11, D12, D13, D14, D15, D16, D17, D18}) → B19Max({A11, A12, A13, A14, A15, A16, A17, A18, B11, B12, B13, B14, B15, B16, B17, B18, C11, C12, C13, C14, C15, C16, C17, C18, D11, D12, D13, D14, D15, D16, D17, D18}) → A19Mode({A11, A12, A13, A14, A15, A16, A17, A18, B11, B12, B13, B14, B15, B16, B17, B18, C11, C12, C13, C14, C15, C16, C17, C18, D11, D12, D13, D14, D15, D16, D17, D18}) → D10Median({A11, A12, A13, A14, A15, A16, A17, A18, B11, B12, B13, B14, B15, B16, B17, B18, C11, C12, C13, C14, C15, C16, C17, C18, D11, D12, D13, D14, D15, D16, D17, D18}) → C10Mode(B2:B5) → A9Min(B2:B5) → A7Max(B2:B5) → A6Median({B2, B3, B4, B5}) → B8Ordinal(Median[A2:A5, B2:B5]) → B9TableText({{A1, B1}, {A2, B2}, {A3, B3}, {A4, B4}, {A5, B5}}, "c_|") → text8Circle(A, B) → cRotate(B, D2, A) → B'Angle(B, A, B') → αRotate(B', D3, A) → B''Angle(B', A, B'') → βRotate(B'', D4, A) → B'''Angle(B'', A, B''') → γCircleSector(A, B', B'') → dCircleSector(A, B, B') → eCircleSector(A, B''', B) → fCircleSector(A, B'', B''') → gTableText({{A1, A2, A3, A4, A5}, {B1, B2, B3, B4, B5}}, "c_|") → text10Element(list3, a) → jTextfield(text33) → inputBox2LaTeX(right, true, true) → text36LaTeX(wrong, true, true) → text37Textfield(Name) → inputBox1Element(list2, a) → text20
AI Drawing Prompt Reference
Create a set of statistical charts for a group of random data, including a stem-and-leaf plot, dot plot, and box plot. First, generate a set of random data, then calculate the median, quartiles, minimum, maximum, and mode of the data. Next, draw the stem-and-leaf plot, dot plot, and box plot to show the data distribution and display these statistical values on the charts.
The prompt above was compiled from the original drawing commands and is for reference only.