
Dynamic Illustration of Plotting Points (x,y)
Loading the math board and drawing, please wait…
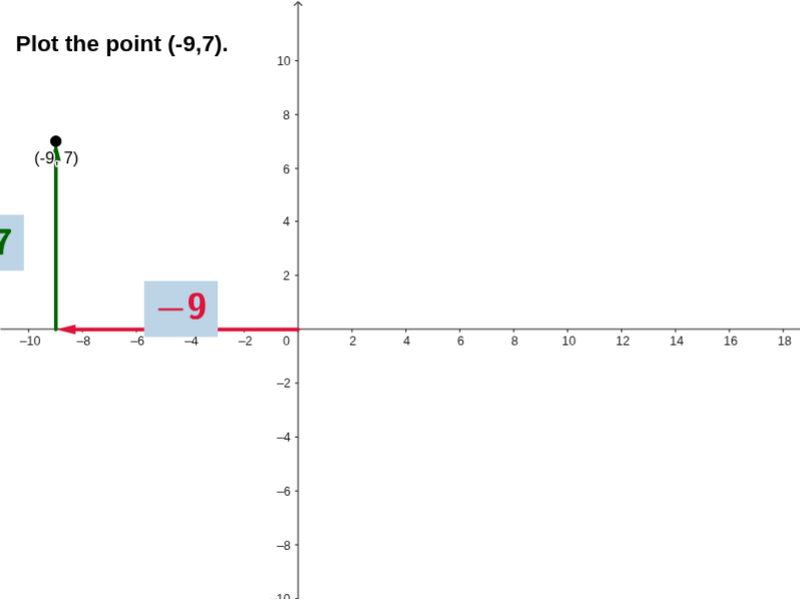
This example demonstrates the process of plotting points (x,y) in the coordinate plane. It involves core math concepts like coordinate geometry, vectors, and transformations. GeoGebra commands and objects used include Random, Intersect, Dilate, Vector, and Distance for constructing the illustration. Suitable for high school mathematics education to understand point coordinates and geometric transformations.
GeoGebra Commands & Parameters
Random(-10, 10) → aRandom(-10, 10) → bIntersect(f, g) → CIntersect(f, h) → DDilate(A, If[0 < e ≤ 1, 1 - e, 0], C) → A'Vector(E, A') → uDistance(E, C) → distanceECDistance(A, C) → distanceACDilate(C, If[1 < e ≤ 2, 2 - e, 0], D) → C'Vector(C, C') → vIntersect(g, xAxis) → FIntersect(f, g) → GDistance(G, D) → distanceGD