
Dynamic Graphing of Exponential Functions y = b^x
Loading the math board and drawing, please wait…
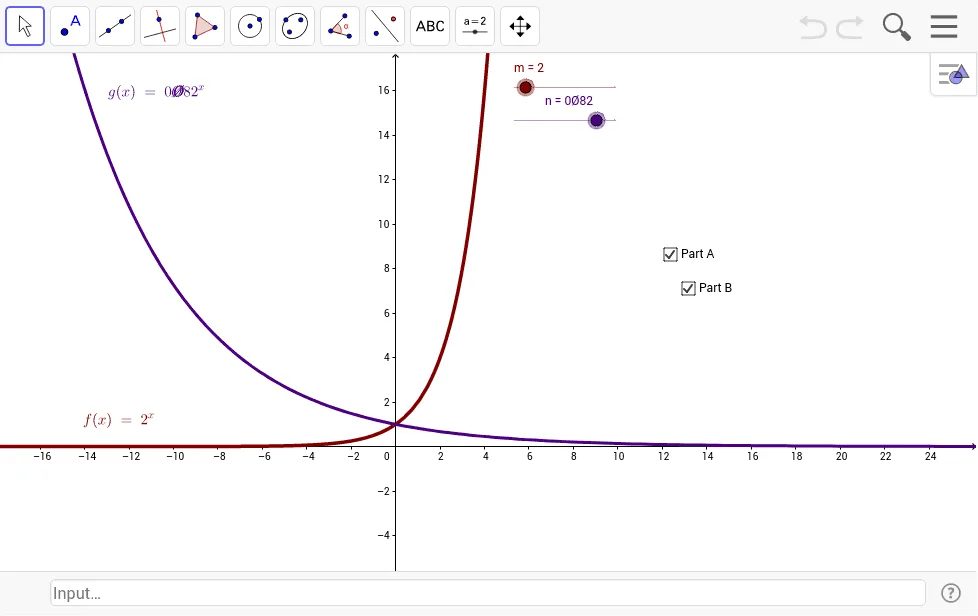
This interactive worksheet demonstrates how the graph of the exponential function y = b^x changes as the base b varies. It covers core concepts such as exponential growth and decay, the role of the base, asymptotic behavior, and symmetry. Construction uses a slider to control the parameter b, defines the function f(x)=b^x, and employs GeoGebra commands like Function, Slider, Point, and Segment to create a dynamic visualization with live text showing the current base value. Suitable for high‑school lessons on exponential functions, college‑prep review, and self‑directed exploratory learning.
GeoGebra Commands & Parameters
Numeric m(2.0)Numeric n(0.82)f(x) = m^(x)g(x) = n^(x)Boolean a(true)Boolean b(true)
AI Drawing Prompt Reference
Create a dynamic graph of the exponential function y = b^x with a slider to adjust the base b. Show two curves: one for b = 2 illustrating rapid growth, and another for b = 0.82 showing slow decay. Include a horizontal slider to change b in real time, displaying the current value. Draw the x‑ and y‑axes and indicate the horizontal asymptote to highlight the function's symmetry and growth/decay behavior.
The prompt above was compiled from the original drawing commands and is for reference only.