
Dynamic Exploration of Quadratic Graph with Parameters a, b, and c
Loading the math board and drawing, please wait…
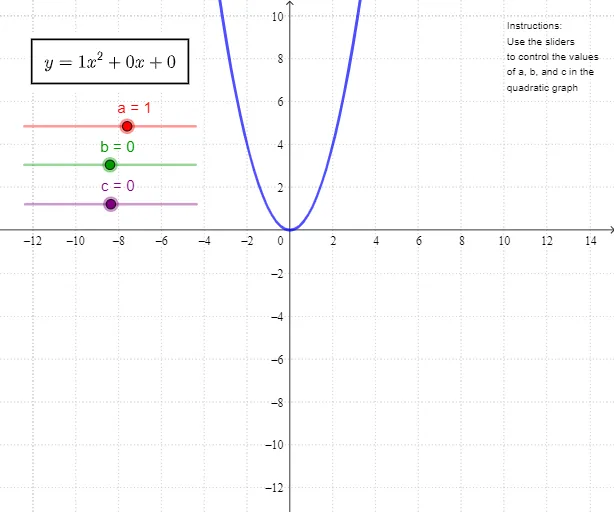
①This example demonstrates how changing the coefficients a, b, and c in the quadratic function y=ax²+bx+c affects the shape and position of its parabolic graph. ②Core mathematical concepts include the properties of quadratic functions, the direction and width of the parabola's opening, the axis of symmetry, the vertex coordinates, and the y-intercept determined by the constant term c. ③Construction details: using GeoGebra, three sliders (objects a, b, c) are created to control the coefficients, a function f(x)=a*x^2+b*x+c is defined, and text objects text1 and text2 display the current function expression or key values, allowing real-time observation of graph changes as sliders are dragged. ④This resource is suitable for middle school to high school students learning quadratic functions, and can be used for classroom demonstrations or independent exploration to deepen understanding of how parameters geometrically influence the graph.
GeoGebra Commands & Parameters
Numeric a(1)Numeric b(0)Numeric c(0)y = (a * x^(2)) + (b * x) + c
AI Drawing Prompt Reference
Draw a dynamic quadratic function graph with sliders for coefficients a, b, c, plot the parabola based on y=ax²+bx+c, and display the function expression and key values like axis of symmetry, vertex coordinates, y-intercept in real-time, observe how changing parameters affects the graph's shape and position by dragging the sliders.
The prompt above was compiled from the original drawing commands and is for reference only.