
Dynamic Exploration of Exponential Functions, Line Segments, and Incircles
Loading the math board and drawing, please wait…
In collections
Mapping Diagrams: From AB to C&DE, Resource
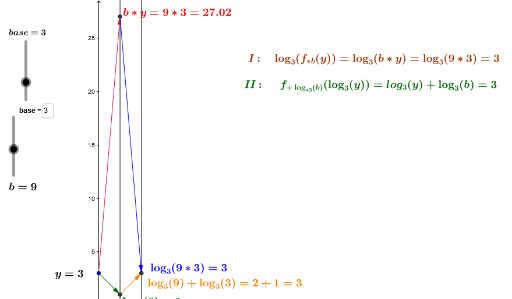
This GeoGebra example dynamically illustrates the interplay between an exponential function graph, a movable line segment, an inscribed circle within a polygon, and a bar chart for comparative data. The core mathematical concepts encompass properties of exponential functions, geometric positioning of line segments, construction of incircles, and data visualization techniques. The construction utilizes GeoGebra commands such as Point, Vector, and Textfield, along with numerous objects (e.g., sliders, input boxes, buttons) to enable real‑time parameter adjustments (e.g., a, b, k). It is designed for high‑school or early university students to explore the integration of algebraic functions and geometric constructions.
GeoGebra Commands & Parameters
Point(yAxis) → AVector(A, B) → uVector(B, C) → vTextfield(f1) → inputBox1Textfield(f2) → inputBox2Vector(C, D) → wTextfield(f3) → inputBox3Textfield(m) → inputBox4_1Vector(A, D) → zVector(A, F) → iVector(F, C) → hVector(C, D) → jVector(B, D) → nVector(D, B) → pPoint(yAxis) → HVector(H, I) → qVector(H, K) → rVector(K, J) → sVector(I, J) → tVector(J, M) → u_1Textfield(base) → inputBox4Vector(I, M) → v_1Vector(M, I) → w_1Vector(H', G') → z_1Vector(H', K') → c_1Vector(K', J') → e_1Vector(G', J') → d_1
AI Drawing Prompt Reference
Draw an exponential function graph in the coordinate system with adjustable sliders to control function parameters; create multiple draggable line segments and vectors to demonstrate geometric relationships; construct an incircle inside a polygon showing the tangential property; include several input fields for real-time function expressions and numerical values; accompany with bar charts for data comparison; present dynamic interaction between algebraic functions and geometric constructions for mathematical exploration learning.
The prompt above was compiled from the original drawing commands and is for reference only.