
Dynamic Demonstration of Standard Deviation in Normal Distribution
Loading the math board and drawing, please wait…
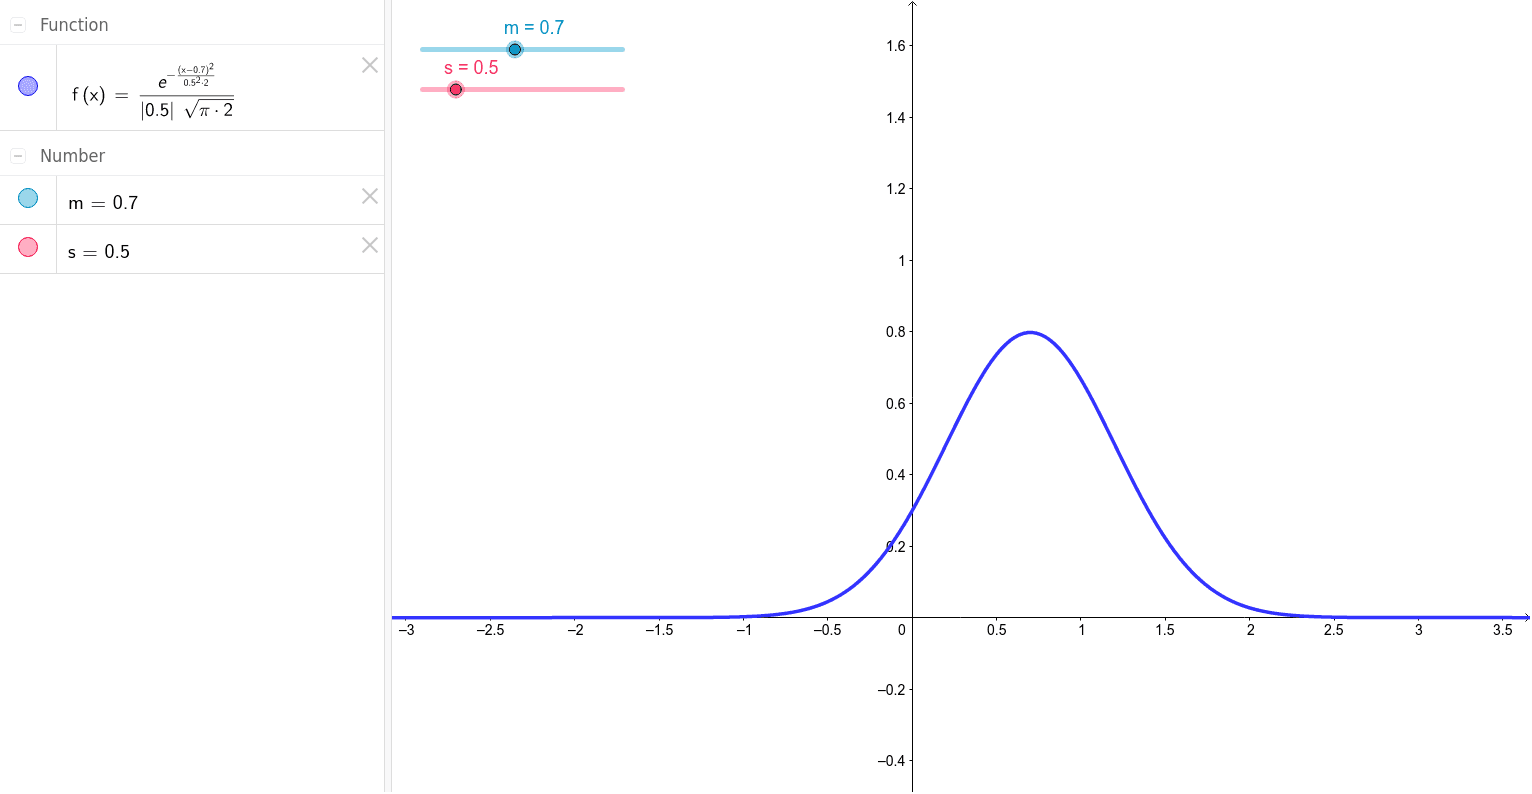
①This GeoGebra example dynamically illustrates how the normal distribution curve changes with the standard deviation (s) and mean (m), visually showing the impact of standard deviation on the shape of the distribution. ②Core mathematical concepts include normal distribution, standard deviation, mean, probability density function, and the relationship between standard deviation and curve flatness/steepness. ③Construction highlights: The Normal command is used to generate the normal probability density function, with sliders m (mean) and s (standard deviation) defined; the object f represents the corresponding function graph, and adjusting the sliders updates the curve in real time. ④Suitable for high school and introductory college statistics courses, this interactive tool helps students grasp the geometric meaning of standard deviation as a measure of spread, explore properties of the normal distribution, and serve as a dynamic demonstration in probability and statistics lessons.
GeoGebra Commands & Parameters
Normal(m, s, x) → f