
Drawing Histograms by Liew Ti Woon
Loading the math board and drawing, please wait…
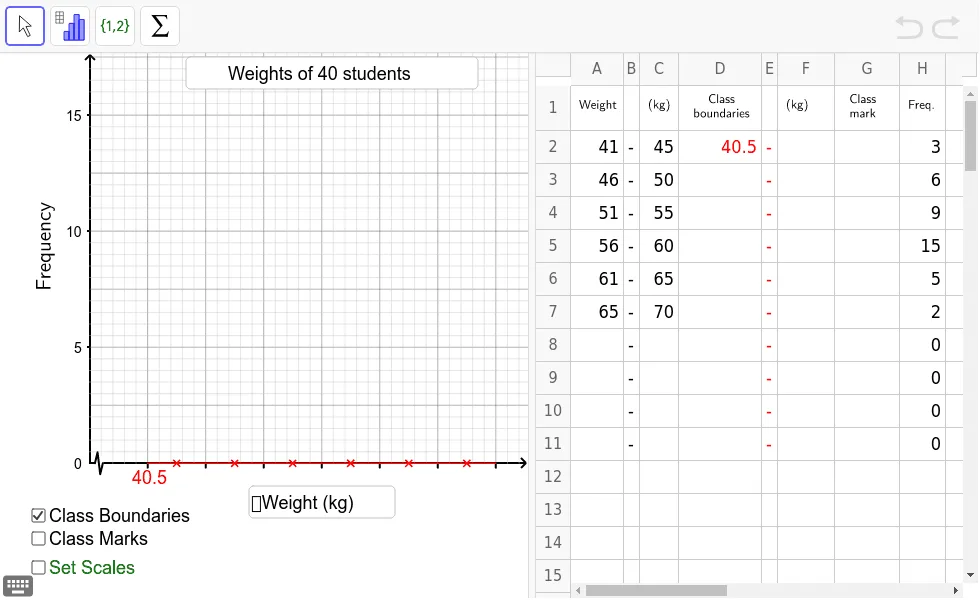
This example demonstrates how to use GeoGebra to draw a histogram representing grouped data. Core math concepts include data grouping, frequency distribution, and histogram construction. It uses commands like If, Point, Polygon, PolyLine, Sequence, Textfield, RotateText. Suitable for middle school math teachers to illustrate data visualization techniques to students.
GeoGebra Commands & Parameters
If(C2 - A2 > 0, C2 - A2 + A3 - C2, 5) → kPoint(Ray[(1.5 * k, 0), (1.5 * k, 1)]) → Q1Point(Ray[(2.5 * k, 0), (2.5 * k, 1)]) → Q2Point(Ray[(3.5 * k, 0), (3.5 * k, 1)]) → Q3Point(Ray[(4.5 * k, 0), (4.5 * k, 1)]) → Q4Point(Ray[(5.5 * k, 0), (5.5 * k, 1)]) → Q5Point(Ray[(6.5 * k, 0), (6.5 * k, 1)]) → Q6Point(Ray[(7.5 * k, 0), (7.5 * k, 1)]) → Q7Point(Ray[(8.5 * k, 0), (8.5 * k, 1)]) → Q8Point(Ray[(9.5 * k, 0), (9.5 * k, 1)]) → Q9Point(Ray[(10.5 * k, 0), (10.5 * k, 1)]) → Q10Polygon((unitx, 0.3), (unitx, -0.3), (2.5 * unitx, -0.3), (2.5 * unitx, 0.3)) → poly1, a, b, c, dPolyLine((unitx, 0), (1.5 * unitx, h), (2 * unitx, -h), (2.5 * unitx, 0)) → eSequence(Polygon[(i * k, 0), ((i + 1) * k, 0), ((i + 1) * k, Element[list1, i]), (i * k, Element[list1, i])], i, 1, n - 1) → list2Sequence(Segment[(xmin + xint2 * i, ymax), (xmin + xint2 * i, ymin)], i, 1, (xmax - xmin) / xint2) → list3Sequence(Segment[(xmin, ymin + yint2 * i), (xmax, ymin + yint2 * i)], i, 1, (ymax - ymin) / yint2) → list4Sequence(Sequence[Segment[(xint2 * (j - 1) + xint1 * i, ymax), (xint2 * (j - 1) + xint1 * i, ymin)], i, 1, 4], j, 1, ceil(xmax / xint2)) → list5Sequence(Sequence[Segment[(xmin, (j - 1) * yint2 + yint1 * i), (xmax, (j - 1) * yint2 + yint1 * i)], i, 1, 4], j, 1, ceil(ymax / yint2)) → list6Sequence(Segment[(k * i + 0.5 * k, 0), (k * i + 0.5 * k, (-h) / 2.5)], i, 1, n - 1) → list9Sequence(Segment[(k * i, 0), (k * i, (-h) / 2.5)], i, 1, n) → list8Textfield(text23) → inputBox2Textfield(text24) → inputBox4Textfield(yint1') → inputBox1Textfield(xint1') → inputBox3RotateText("Frequency", 90*°) → text12