
Draw Grids
Loading the math board and drawing, please wait…
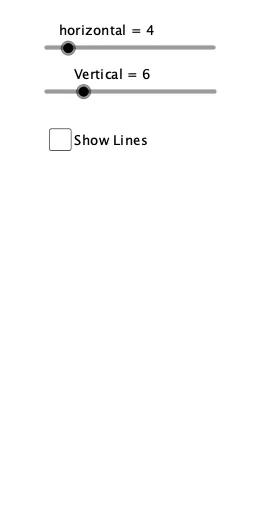
This example demonstrates how to use GeoGebra to draw grids. Key mathematical concepts include coordinate geometry and segments. Commands such as Point, Segment, and Sequence are used to construct the grid lines. Suitable for students at the junior high school level and above to learn about coordinate systems and grid drawing.
GeoGebra Commands & Parameters
Point(yAxis) → BSegment(B, C) → fSegment(C, D) → gSegment(A, D) → hSegment(A, B) → iSequence(B + ((k * len / horizontal), 0), k, 1, horizontal - 1) → L_1Sequence(A + ((k * len / horizontal), 0), k, 1, horizontal) → L_2Sequence(B + (0, ((-k) * len / Vertical)), k, 1, Vertical) → L_3Sequence(C + (0, ((-k) * len / Vertical)), k, 1, Vertical) → L_4Sequence(Segment[L_2(k), L_2(k) + (0, segLen)], k, 1, horizontal - 1) → L_6Sequence(Segment[L_4(k), L_4(k) - (segLen, 0)], k, 1, Vertical - 1) → L_8Sequence(Segment[L_1(k), L_1(k) - (0, If[a, len, segLen])], k, 1, horizontal - 1) → L_5Sequence(Segment[L_3(k), L_3(k) + (If[a, len, segLen], 0)], k, 1, Vertical - 1) → L_7
AI Drawing Prompt Reference
Draw a coordinate grid with horizontal and vertical lines. Start by drawing two vertical line segments and two horizontal line segments to form a rectangle. Then, use loops to generate multiple horizontal and vertical line segments parallel to the sides of the rectangle, creating a complete grid. Pay attention to the lengths and spacing of the line segments to ensure the grid is evenly distributed.
The prompt above was compiled from the original drawing commands and is for reference only.