
Division Demonstration
Loading the math board and drawing, please wait…
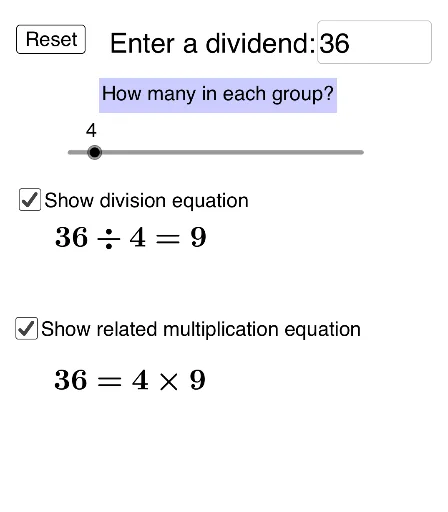
This example demonstrates the geometric representation of division, visually showing the relationship between dividend, divisor, quotient, and remainder. Core math concepts include division, frequency distribution, Poisson distribution, median value, and boxplot. It uses GeoGebra commands like Textfield, If, Sequence, First, Last, Min, Max, Segment, Text, and objects such as n, divisor, dividendList, remainderList. Suitable for high school and above learners to understand division operations and data analysis.
GeoGebra Commands & Parameters
Textfield(nText) → InputBox1If(n / divisor ≟ floor(n / divisor), false, true) → hasRSequence(((-columns)) / 2 + i - 1 / 2, i, 1, columns) → xValuesSequence(((-divisor) - 1) / 2 + i, i, 1, divisor) → yValuesFirst(Flatten[Sequence[Sequence[Point[{xValues(i), yValues(j)}], j, 1, Length[yValues]], i, 1, columns]], n) → list2If(hasR, First[list2, (divisor * Div[n, divisor])], list2) → dividendListLast(list2, n - (divisor * Div[n, divisor])) → remainderListMin(xValues) → leftMax(xValues) → rightMin(yValues) → bottomMax(yValues) → topSequence(Circle[Element[dividendList, i], 0.4], i, 1, Length[dividendList]) → dividendCirclesSequence(Circle[Element[remainderList, i], 0.4], i, 1, Length[remainderList]) → remainderCirclesSegment((left, bottom) + (-1 / 2, -1 / 2), (right, bottom) + (1 / 2, -1 / 2)) → iSegment((left, top) + (-1 / 2, 1 / 2), (right, top) + (1 / 2, 1 / 2)) → jSequence(Segment[(left + i, bottom) + (-1 / 2, -1 / 2), (left + i, top) + (-1 / 2, 1 / 2)], i, 0, Length[xValues]) → dividendBoxesText(If[hasR, " + " + (Mod[n, divisor]), ""]) → text4Sequence(Circle[Element[moving, i], 0.4], i, 1, Length[moving]) → movingCircles