
Distribution of Sample Means
Loading the math board and drawing, please wait…
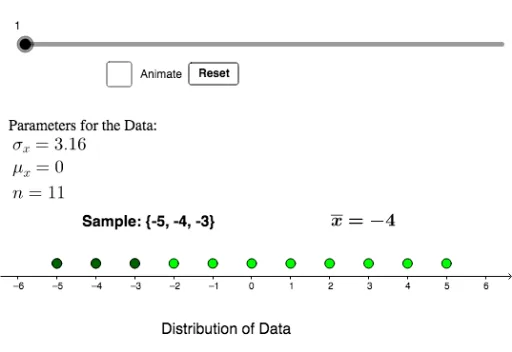
This example demonstrates the distribution of sample means. It involves core concepts of random variables and probability & statistics. Using the DotPlot command, it visually illustrates the distribution of sample means. Suitable for high school mathematics education, particularly in probability and statistics courses.
GeoGebra Commands & Parameters
DotPlot(L_2) → L_3DotPlot(L_1) → L_4DotPlot(First[L_1, a]) → L_5DotPlot(Element[M_1, a]) → L_6DotPlot(L_8) → L_9