
Discrete vs Continuous
Loading the math board and drawing, please wait…
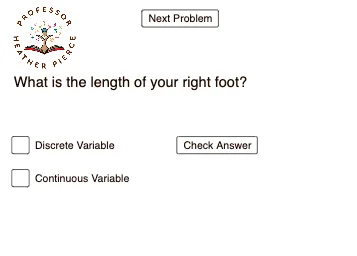
This example visually demonstrates the difference between discrete data points and continuous curves on a coordinate plane. It involves core math concepts like random variables, statistics, functions, rational numbers, arithmetic mean, and linear equations. Construction uses commands like Random and If, along with interactive objects such as sliders and buttons. Suitable for high school and above in probability & statistics and function graphing education.
GeoGebra Commands & Parameters
Random(1, 24) → countIf(count ≟ 1 ∨ count ≟ 40 ∨ count ≟ 38 ∨ count ≟ 37 ∨ count ≟ 30 ∨ count ≟ 29 ∨ count ≟ 28 ∨ count ≟ 27 ∨ count ≟ 22 ∨ count ≟ 21 ∨ count ≟ 20 ∨ count ≟ 18 ∨ count ≟ 16 ∨ count ≟ 15 ∨ count ≟ 3 ∨ count ≟ 4 ∨ count ≟ 5 ∨ count ≟ 6 ∨ count ≟ 11 ∨ count ≟ 13, true, false) → cat
AI Drawing Prompt Reference
Display discrete data points and continuous curves on a coordinate plane, generate specific numbers of points using a random function, set certain points as true and others as false, decide point visibility based on conditions, and differentiate true and false points with different colors or shapes, while also drawing a continuous function curve for comparison.
The prompt above was compiled from the original drawing commands and is for reference only.