
Discovering Trigonometric Ratios: From Right Triangles to Function Graphs
Loading the math board and drawing, please wait…
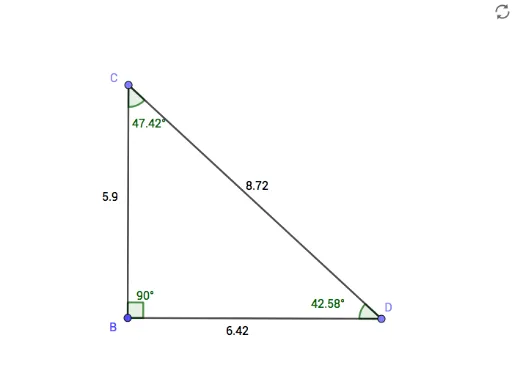
① This interactive GeoGebra example helps learners visually discover the definitions of trigonometric ratios (sine, cosine, tangent) in right triangles and how they vary with angle changes. ② Core mathematical concepts include trigonometric ratios, similar triangles, angle-side relationships, and the graphical representation of trigonometric functions. ③ Construction highlights: using GeoGebra commands such as Rotate, Angle, Line, Point, and Segment, the example builds a right triangle with dynamic angles α, β, γ and objects A, B, A', f, C, g, i, j, D, h, k, allowing real-time exploration of ratio changes and their connection to the function graph f. ④ Suitable for upper middle school or early high school students, ideal for introductory trigonometry lessons, teacher demonstrations, and bridging geometric intuition with functional abstraction.
GeoGebra Commands & Parameters
Rotate(A, (-(90°)), B) → A'Angle(A', B, A) → αLine(A, B) → fPoint(f) → CSegment(A', B) → gSegment(C, B) → iLine(B, A') → jPoint(j) → DSegment(B, D) → hSegment(D, C) → kAngle(C, D, B) → βAngle(B, C, D) → γ
AI Drawing Prompt Reference
Draw a right triangle with one acute angle that can change dynamically, showing the ratio of the opposite side to the hypotenuse (sine) varying with the angle. Label the corresponding side lengths within the triangle and plot a function graph related to this angle, ensuring the points on the graph correspond to the ratio of the triangle's sides, visually demonstrating the geometric meaning of the sine function.
The prompt above was compiled from the original drawing commands and is for reference only.