
Dice Rolling Simulation (Probability & Statistics)
Loading the math board and drawing, please wait…
In collections
Probability & Intro. to Stat.
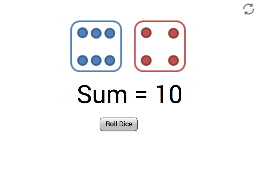
① This example demonstrates an interactive dice rolling simulation that generates random outcomes and displays the corresponding dice face images, illustrating the process of random events. ② The core mathematical concepts are probability and statistics, including random variables, equally likely events, the relationship between frequency and probability, and how repeated simulations show frequency approaching theoretical probability. ③ Construction highlights: It uses the GeoGebra Random command to generate random integers, and employs multiple image objects (pic1 to pic12) to represent the six faces of a die (possibly with different colors or styles), with conditional logic or sliders to control which image is shown; a text object (text1) displays the current roll or statistical results, and variables such as Roll, b, r control the number of simulations and outcomes. ④ It is suitable for middle school to high school probability and statistics lessons, as well as introductory college statistics courses, serving as a classroom demonstration or a tool for students to explore random phenomena independently.
GeoGebra Commands & Parameters
Random(1, 6) → bRandom(1, 6) → r
AI Drawing Prompt Reference
Create an interactive dice rolling simulation scene. In the center, show a six-sided die with its current face displayed using distinct colored or styled images for each of the six outcomes. Include a slider or button to control the number of rolls, and a text area showing the latest roll result and statistical frequency. Optionally, add a simple bar chart or frequency plot in the background, where the observed frequencies approach theoretical probabilities as rolls increase. Keep the layout clear for classroom use, emphasizing randomness and probability.
The prompt above was compiled from the original drawing commands and is for reference only.