
Dice Rolling Simulation by Tor Espen Kristensen
Loading the math board and drawing, please wait…
In collections
probability
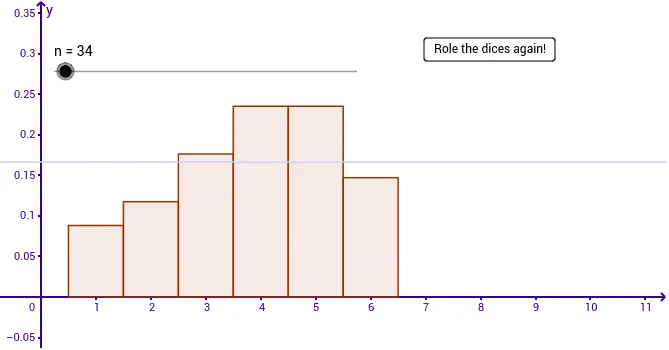
This example demonstrates the simulation of dice rolling and its statistical outcomes. It involves core math concepts like Probability & Statistics, Sequence, and Data Visualization. Constructed using GeoGebra commands/objects such as Sequence, BarChart, and CountIf. Suitable for high school students learning probability and data analysis.
GeoGebra Commands & Parameters
Sequence(Random[1, 6], i, 1, n) → LBarChart(L, 1) → aCountIf(x ≟ A2, L) → C2CountIf(x ≟ A3, L) → C3CountIf(x ≟ A4, L) → C4CountIf(x ≟ A5, L) → C5CountIf(x ≟ A6, L) → C6CountIf(x ≟ A1, L) → C1BarChart({1, 2, 3, 4, 5, 6}, D1:D6) → b
AI Drawing Prompt Reference
Create a dice rolling simulation graph with 6 bar charts representing the frequency of rolling 1 to 6 points. First, generate a sequence of random numbers from 1 to 6, then use BarChart to draw the initial bar chart, and finally count the occurrences of each point and draw another bar chart to show these counts.
The prompt above was compiled from the original drawing commands and is for reference only.