
Determination of Half-Life (2) - Finding x given y with Function
Loading the math board and drawing, please wait…
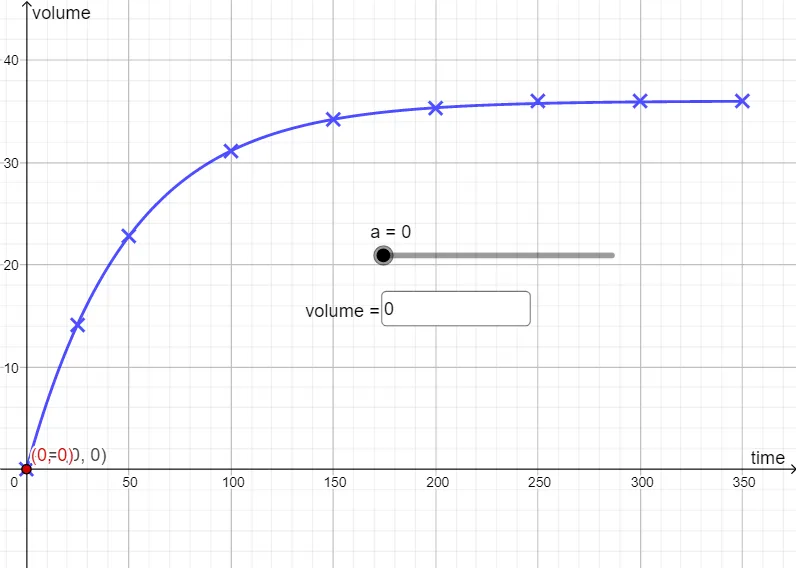
This example demonstrates how to determine half-life using a function and coordinate geometry methods. Core math concepts include exponential functions, equation solving, and coordinate system applications. Construction highlights involve using GeoGebra commands/objects like Textfield, objects f, A₁, B, C, D, E, F, a, G, H, I, A, u, InputBox1, and J. Suitable for high school students learning exponential functions and data analysis.
GeoGebra Commands & Parameters
Textfield(u) → InputBox1
AI Drawing Prompt Reference
Draw a graph to show half-life calculation. The graph should include a coordinate system, a function image, a point for the initial value, a point for the half-life value, and text labels to explain the relationship between these points. The construction order is to first draw the coordinate system, then the function image, add the points, and finally add the labels.
The prompt above was compiled from the original drawing commands and is for reference only.