
Descartes Curve Generator
Loading the math board and drawing, please wait…
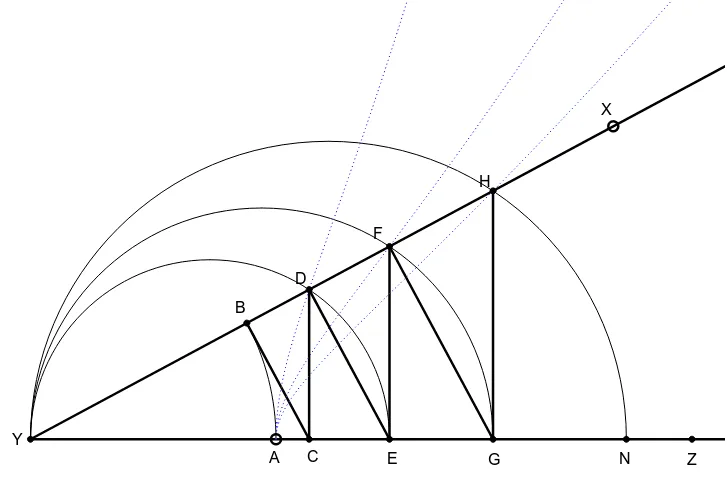
This example demonstrates the generation of Descartes curves. It involves curve drawing and transformations in coordinate geometry. Using GeoGebra commands such as Intersect, Point, Line, etc., various curves can be dynamically generated. Suitable for high school mathematics education and learning curve drawing techniques.
GeoGebra Commands & Parameters
Intersect(xAxis, yAxis) → YPoint(xAxis) → WLine(Y, W) → b_1Ray(Y, W) → aCircle(W, 1) → kIntersect(k, a, 1) → ZCircle(Y, Z) → pIntersect(p, b_1, 1) → ISemicircle(I, Z) → g_1Point(g_1) → XRay(Y, X) → bPoint(a) → ACircle(Y, A) → cIntersect(c, b, 1) → BOrthogonalLine(B, b) → dIntersect(d, a) → COrthogonalLine(C, a) → eIntersect(e, b) → DOrthogonalLine(D, b) → fIntersect(f, a) → EOrthogonalLine(E, a) → gIntersect(g, b) → FOrthogonalLine(F, b) → hIntersect(h, a) → GOrthogonalLine(G, a) → iIntersect(i, b) → HOrthogonalLine(H, b) → jIntersect(j, a) → NSegment(B, C) → nSegment(C, D) → qSegment(D, E) → rSegment(E, F) → sSegment(F, G) → tSegment(G, H) → a_1CircleArc(Y, A, B) → c_1Semicircle(Y, E) → d_1Semicircle(Y, G) → e_1Semicircle(Y, N) → f_1Locus(D, X) → loc1Locus(F, X) → loc2Locus(H, X) → loc3
AI Drawing Prompt Reference
Draw a Descartes curve by first finding the intersection Y on the axes, then taking point W on the Y-axis and drawing a horizontal line b₁ and a ray a through W. Draw a circle k with W as the center and intersect it with ray a at point Z. Then draw a circle p with Z as the center and intersect it with b₁ at point I, and continue this process to construct a series of perpendicular rays and circles, forming arcs and line segments such as c₁, d₁, e₁, f₁, loc1, loc2, and loc3.
The prompt above was compiled from the original drawing commands and is for reference only.