
Derivatives, Stationary Points, and Inflections by Dave McGee
Loading the math board and drawing, please wait…
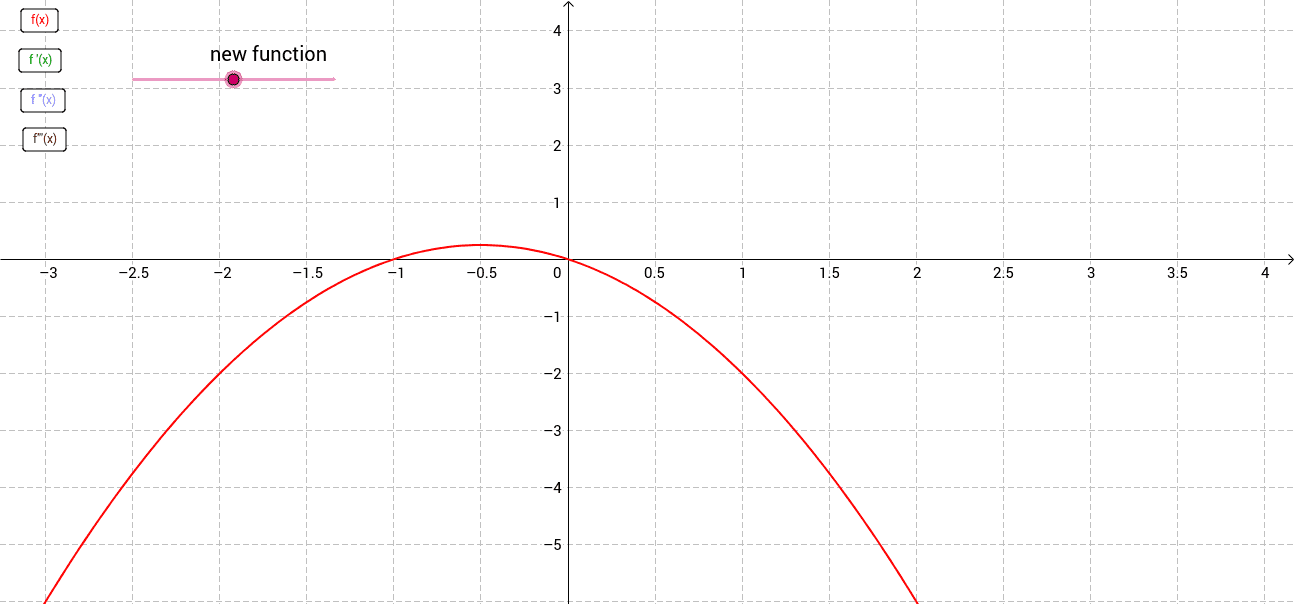
This example illustrates the concepts of derivatives, stationary points, and inflections. By plotting the graph of a function, it provides a visual understanding of the geometric meaning of derivatives and how to use derivatives to find the extremum points and inflection points. The Derivative command in GeoGebra is used to calculate derivatives, and slider animations are employed to dynamically show the changes in the function. Suitable for high school mathematics education and students learning calculus.
GeoGebra Commands & Parameters
Derivative(f) → gDerivative(g) → hDerivative(h) → i
AI Drawing Prompt Reference
Plot a function and its first and second derivative graphs to illustrate the concept of derivatives, including extremum points and inflection points. First, draw the function graph, then calculate and display its first derivative graph, followed by calculating and displaying the second derivative graph of the first derivative. Finally, use animation to demonstrate changes in the function graph.
The prompt above was compiled from the original drawing commands and is for reference only.