
Derivatives of Polynomial Functions: Tangent and Slope Visualization
Loading the math board and drawing, please wait…
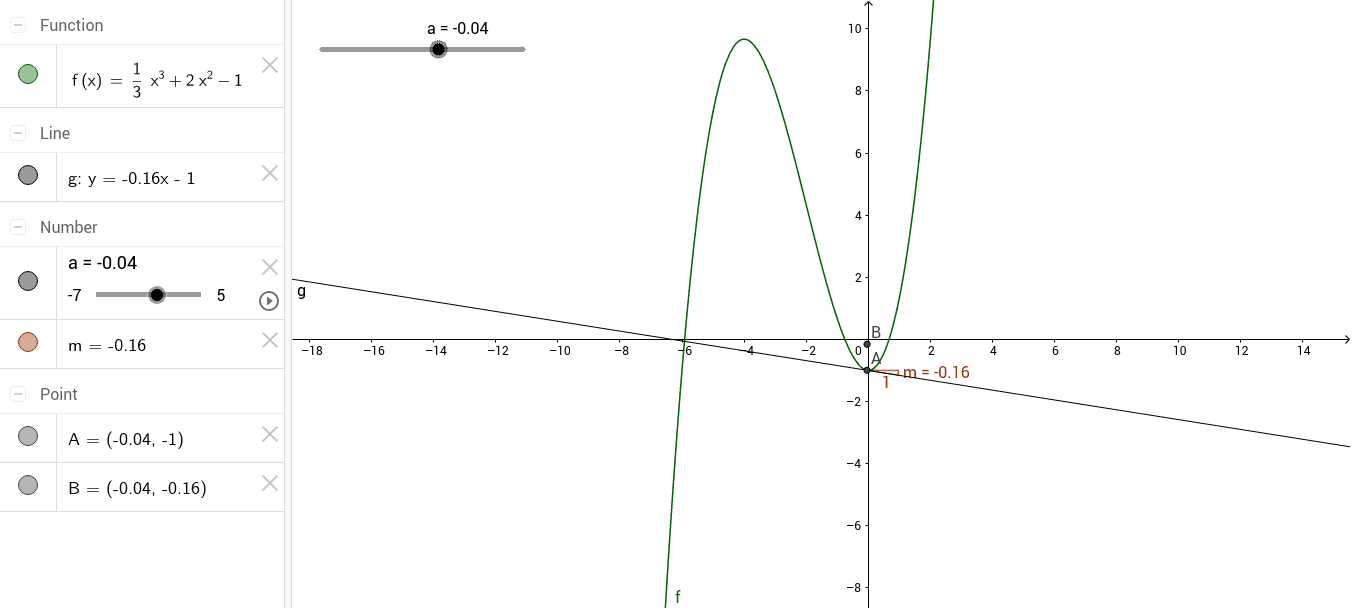
① This GeoGebra example dynamically illustrates the tangent line and its slope at a movable point on a polynomial function, making the geometric meaning of the derivative as an instantaneous rate of change visually intuitive. ② Core mathematical concepts include polynomial functions, derivatives, tangent slopes, and intersections of function graphs, with extensions to exponential functions, geometric mean, and correlation. ③ Construction highlights: using the Tangent command to create the tangent line g to the function f at point A, the Slope command to compute the slope m of the tangent, and a point B to track the slope value; dragging point A reveals how the tangent and slope change along the curve. ④ Suitable for high school to early college calculus courses, ideal for classroom demonstrations or student self-exploration to grasp the relationship between derivatives and local behavior of functions.
GeoGebra Commands & Parameters
Tangent(A, f) → gSlope(g) → m
AI Drawing Prompt Reference
Draw the graph of a polynomial function with a movable point on it. Show the tangent line at this point and its slope, using a distinct color or style for the tangent line, and display the slope value nearby. As the point is dragged along the curve, the tangent line and slope should dynamically update to illustrate the concept of the derivative as an instantaneous rate of change.
The prompt above was compiled from the original drawing commands and is for reference only.