
Derivatives as Functions: Dynamic Tangent and Derivative Graph
Loading the math board and drawing, please wait…
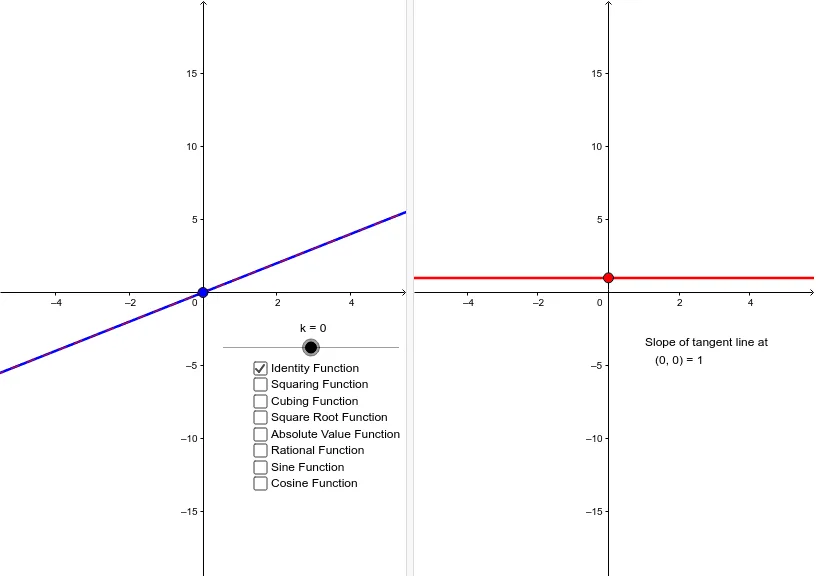
This applet demonstrates the derivative as a function by showing a moving tangent line on the original function (left panel) and its corresponding derivative graph (right panel) in real time. The core mathematical concept is the derivative as the slope of the tangent line, visualized through similar triangles and the limit process. The construction uses GeoGebra commands such as If and Slope, with objects including the function f, tangent line a, slope value k, derivative function df, and several auxiliary points (a, b, c, d, e, f, etc.). It is suitable for high school or early college calculus students to grasp the transition from instantaneous rate of change to the derivative function, and for classroom demonstrations by teachers.
GeoGebra Commands & Parameters
If(a, Tangent[K, f_1], If[b, Tangent[K, f_2], If[c, Tangent[K, f_3], If[d, Tangent[K, f_4], If[e, Tangent[K, f_5], If[f, Tangent[K, f_6], If[g, Tangent[K, f_7], If[h, Tangent[K, f_8]]]]]]]]) → lSlope(l) → mIf(a, Derivative[f_1], If[b, Derivative[f_2], If[c, Derivative[f_3], If[d, Derivative[f_4], If[e, Derivative[f_5], If[f, Derivative[f_6], If[g, Derivative[f_7], If[h, Derivative[f_8]]]]]]]]) → df
AI Drawing Prompt Reference
Create a two-panel dynamic visualization: on the left, a tangent line slides along a given function curve, with its slope highlighted via similar triangles; on the right, the corresponding derivative function graph updates in real time as the tangent point moves. Include multiple selectable function curves (toggled via checkboxes) and a slider controlling the tangent point position. Emphasize the geometric interpretation of the derivative as the slope of the tangent line, suitable for classroom demonstration.
The prompt above was compiled from the original drawing commands and is for reference only.